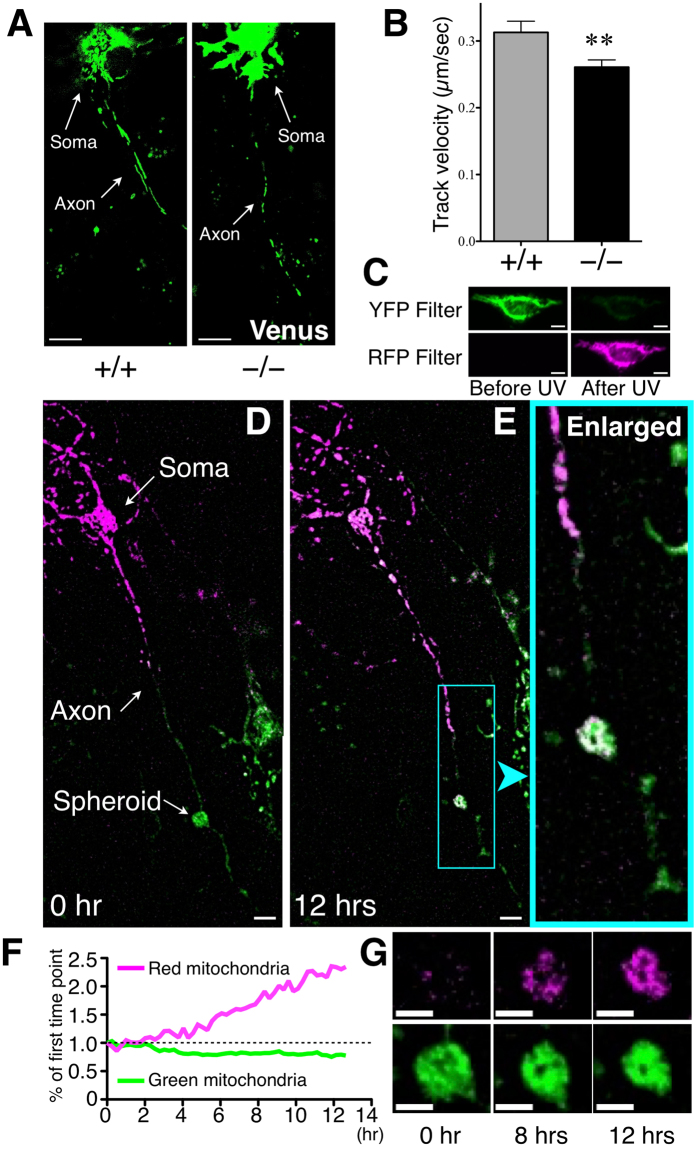
Figure 3.
Live imaging analysis of axonal transport. (A) Representative images of cultured Elavl3+/+ or Elavl3−/− Purkinje cells expressing mito–Venus under control of the CAG promoter. (B) Velocity of mitochondria was semi-automatically calculated using Volocity® software (Elavl3+/+, n = 160 mitochondria from 9 Purkinje cells; Elavl3−/−, n = 361 mitochondria from 10 Purkinje cells). **P < 0.01 (Student’s t-test). Scale bar, 10 μm. (C) Representative images of HeLa cells expressing mito–KikGR under control of the L7 promoter. The fluorescent color of mito–KikGR is mostly converted from green to red by 60 sec of UV irradiation. Scale bar, 10 μm. (D–G) Cultured Elavl3−/− Purkinje cells were transfected with a lentiviral vector expressing mito–KikGR under control of the L7 promoter (green) and cytoplasmic mitochondria were photoconverted to red. (D and E) Representative images of cultured Purkinje cells expressing mito–KikGR at 0 hr (D) and at 12 hr (E). Scale bar, 10 μm. (F) A plot of the mito–KikGR signal intensity within spheroids. The signal intensity of each color of mito–KikGR at the first time point was defined as 1. (G) Representative time-course images of spheroid. Red mitochondria from soma gradually accumulated within the spheroid (also see Supplementary movie S3). Scale bar, 5 μm.

