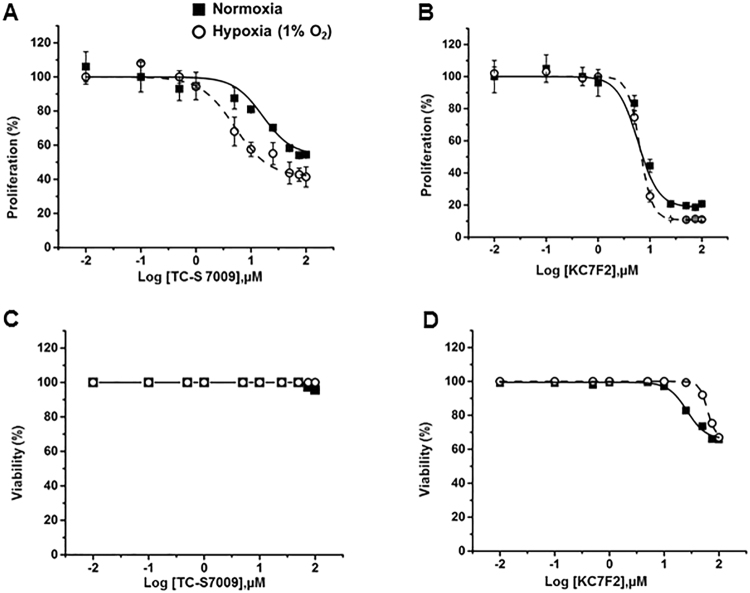
Figure 3.
Effects of HIF inhibitors on HPF cell proliferation. HPFs were treated with the HIF-1α inhibitor KC7F2 or the HIF-2α inhibitor TC-S 7009 and exposed to normoxia and hypoxia (1% O2) for 3 days. (A,B) Cell proliferation as determined by BrdU assay. Cells were incubated with BrdU for 12 hrs. (C,D) Cell viability as determined by LDH assay. Data were expressed as a percentage of control (0 µM inhibitor) for each oxygen condition. The absorbance of control at normoxia for proliferation was 0.39 ± 0.06 (n = 3) and for hypoxia was 0.66 ± 0.16 (n = 3). The viability (%) was calculated as 100% -cytotoxicity %. Cytotoxicity % = [(LDH activity of sample -Spontaneous LDH activity)/(Maximum LDH activity -Spontaneous LDH activity)] × 100. The absorbance of control at normoxia for LDH activity was 0.17 (n = 2) and for hypoxia was 0.16 (n = 2). Maximum and spontaneous LDH activity values for normoxia were 0.26 and 0.17 (n = 2), respectively. Maximum and spontaneous LDH activity values for hypoxia were 0.27 and 0.17 (n = 2), respectively. Values represent means ± SE for proliferation and means for viability.

