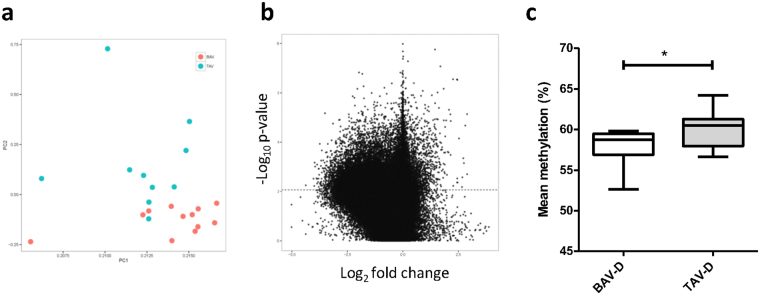
Figure 4.
Differential DNA methylation, BAV and TAV dilated (D) ascending aortas. (a) Principle component analysis of BAV (pink) and TAV (blue) DNA methylation using M-values; (b) Volcano plot of −log10 (P-value) against log2 (fold-change) of beta values, representing differential methylation between BAV and TAV (t-test). Dashed line represents the Bonferroni-adjusted threshold for statistical significance; (c) mean DNA methylation, presented as (%) ± standard deviation (t-test). *P ≤ 0.05. N = 14 BAV and N = 13 TAV.

