Fig. 4.
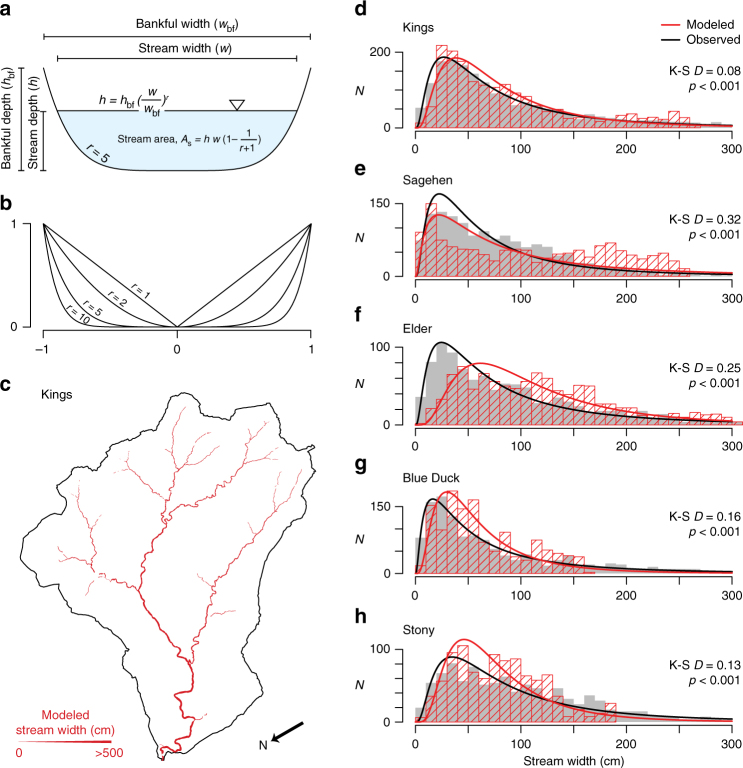
Origin of the lognormal stream width distribution. a Schematic channel cross section; b schematic relationship between the shape parameter, r, and channel cross-sectional shape; c map of modeled stream widths in example study catchment. Length of north arrow is 200 m. d–h The distribution of modeled stream widths compared to field observations. N: measurement frequency. K–S D: Kolmogorov–Smirnov test statistic. p: calculated probability

