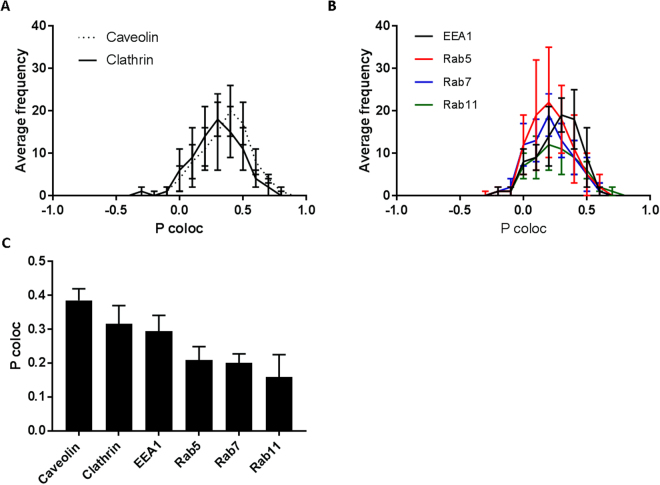
Figure 6.
Co-localization analysis of ML1 and endosomal pathway specific antibodies: (A) Pearson’s coefficient frequency distribution of ML1 co-localization with caveolin or clathrin specific antibodies; (B) Pearson’s coefficient frequency distribution of ML1 co-localization with early, late endosome or lysosome specific antibodies; (C) Median Pearson’s coefficient of ML1 and endosomal pathway specific antibodies co-localization. CT26 cells were incubated with 10 µg/mL of ML1 for 2 h, then fixed, permeabilized and stained with specific antibodies.

