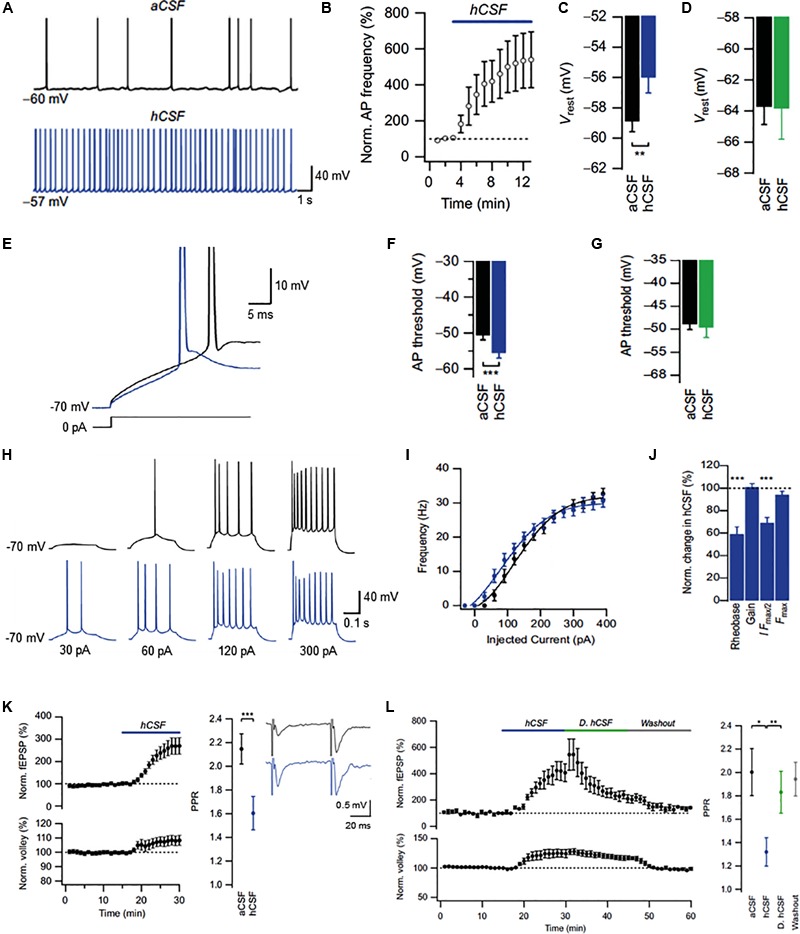
FIGURE 2.

Effects of human CSF on CA1 pyramidal cells in the rat hippocampus. (A) Example traces of spontaneous action potentials recorded at resting membrane potential (Vrest) in aCSF and after 10 min of hCSF perfusion. (B) Summary graph of the effect of hCSF on spontaneous firing at Vrest. (C,D) Summary bar graphs showing effect of hCSF on Vrest under conditions of unperturbed (C) and clamped (D) G-protein activity. (E) Example traces of action potential threshold recorded in aCSF and after 10 min of hCSF perfusion. (F,G) Summary bar graphs showing effect of hCSF on action potential threshold under conditions of unperturbed (F) and clamped (G) G-protein activity. (H) Example traces of action potentials evoked by depolarizing current injections from –70 mV in aCSF and after 10 min of hCSF perfusion. (I) Summary graph of the effect of hCSF on the frequency-current (input–output) relationship in CA1 pyramidal cells. (J) Summary graph showing normalized change in rheobase, gain (slope), amount of injected current required to reach 50% of maximum firing frequency (I Fmax/2) and maximum firing frequency (Fmax) in hCSF. (K) Summary graph showing effect of hCSF on the EPSP slope (upper left graph), fiber volley (lower left graph), and paired-pulse ratio (PPR) in extracellular field recordings from CA1 stratum radiatum. (L) Summary graph of the effect of normal vs. dialyzed hCSF (hCSF and D. hCSF) on the EPSP slope (upper graph) and fiber volley (lower graph) in extracellular field recordings. ∗P < 0.05; ∗∗P < 0.01; ∗∗∗P < 0.001. Adapted from Bjorefeldt et al. (2015).
