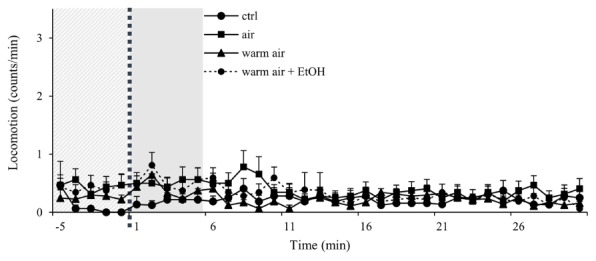
FIGURE 2.

Control experiments show minimal disturbance of locomotor activity in wt males. Kinetic line graphs of locomotor activity in different control groups. Group no treatment represent flies with normal activity without any experimental exposures, air - 2.5 L/min air flow for 1 min, warm air - 2.5 L/min air flow for 1 min, following 8 min of heating, warm air + EtOH - 2.5 L/min air flow for 1 min following 8 min of heating of 75 μL of 96% ethanol. Experiments n = 32 flies per group, were repeated for each group three times. Light gray panel represents locomotor activity 5 min before exposure for all groups, dotted line is time of the exposure, and darker gray panel denotes 5 min after exposure. Data are plotted as mean + SEM of counts/min, with a resolution of 1 min.
