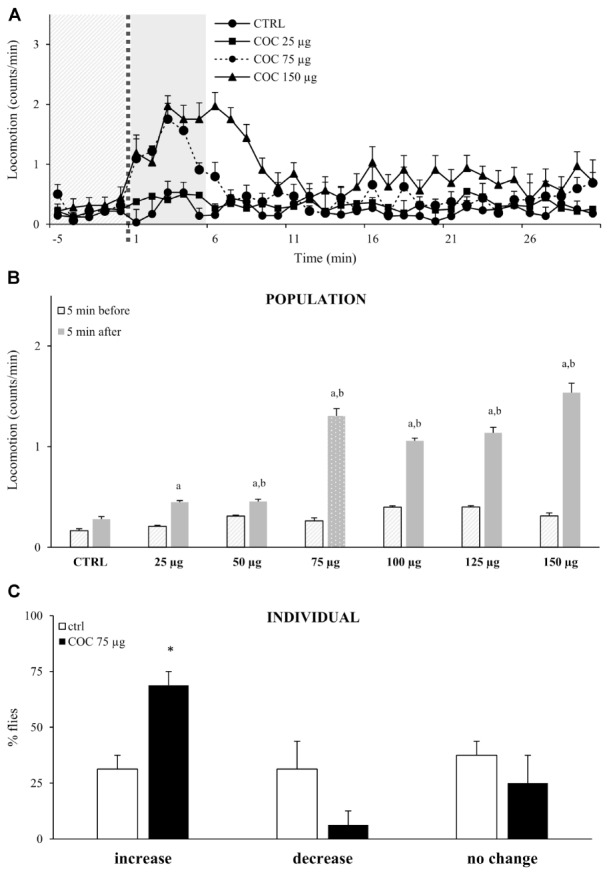
FIGURE 3.

Exposure to vCOC transiently and dose-dependently increases locomotor activity. (A) Kinetic graph of locomotion expressed as number of counts per minute for a control group of flies exposed to warm air (ctrl) and of groups exposed to vCOC concentrations of 25 μg (COC 25 μg), 75 μg (COC 75μg), or 150 μg (COC 150μg). Experiments n = 32 flies per group, were repeated for each group three times The light gray panel indicates the 5 min immediately prior to exposure, the dotted line is the time of exposure and the dark gray panel indicates 5 min after exposure. (B) Mean locomotor activity + SEM for vCOC concentrations ranging from 25 to 150 μg (n = 32 flies per treatment) for the 5 min immediately before and after cocaine exposure. Statistical significance (p ≤ 0.05) indicated by a: within group comparison of locomotion before and after administration (t-test for dependent samples); b: between group comparison for 5 min after exposure (t-test for independent samples). (C) Changes in level of locomotor response of individual flies where amount of locomotor activity for individual fly after exposure to 75 μg of vCOC (8 min heating, 1 min exposure and 2.5 L/min air flow) or warm air control (ctrl) (n = 32 for each group). Changes are categorized as increase, decrease or no change, based on locomotion in the 5 min immediately after exposure, compared to the 5 min before. ∗χ2 test statistical significance (p ≤ 0.05) between group comparison.
