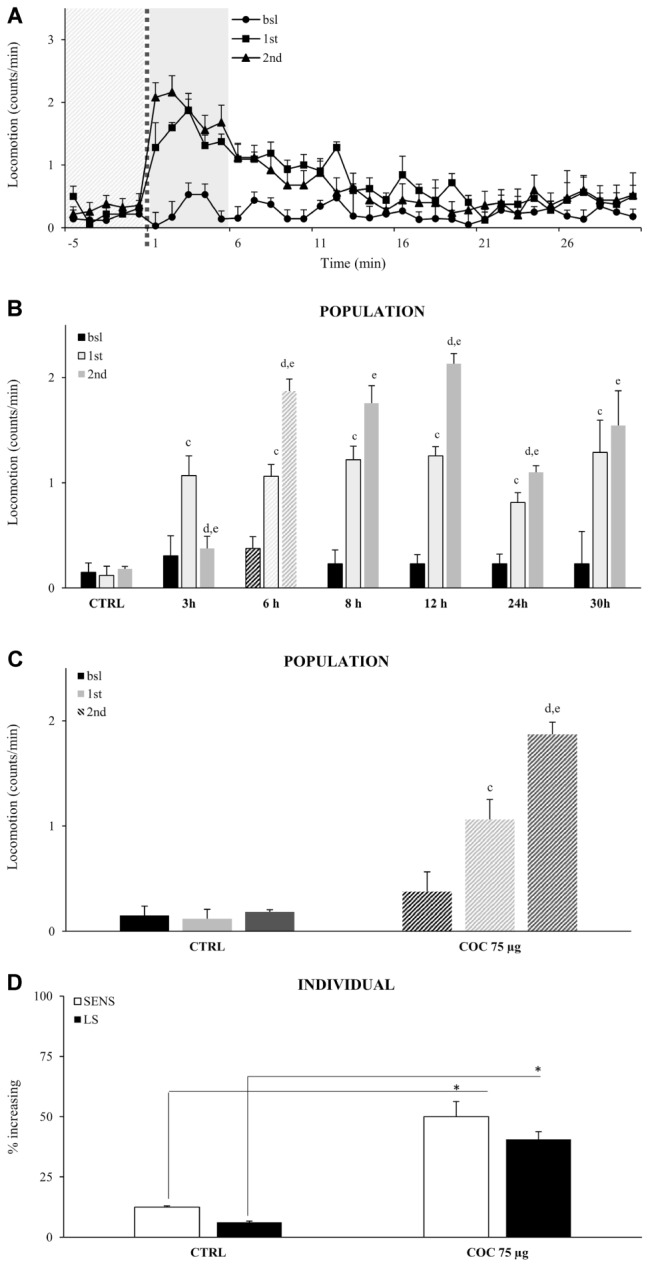
FIGURE 4.

Locomotor sensitization to vCOC depends on time interval between exposures wile only limited number of individual flies in a population develops locomotor sensitization to vCOC. (A) Kinetic graph of average locomotion (counts per minute) for group of flies (n = 32) before administration (bsl), and after administrations of 75 μg vCOC first at 09:00 AM (1st) and then a second administration at 03:00 PM (2nd). Light gray panel 5 min before exposure, dotted line is time of the exposure, dark gray panel 5 min after exposure. (B) Histogram of different duration of time intervals between two administrations of vCOC (75 μg), plotted as a mean of population (32 flies) locomotor activity 5 min before (bsl) and 5 min after COC (1st) exposures at 09:00 AM and 2nd at different time points [12:00 AM (3 h), 03:00 PM (6 h), 05:00 PM (8 h), 09:00 PM (12 h), 09:00 AM of the following day (24 h) and 03:00 PM of the following day (30 h)], +SEM. The control (CTRL) group was exposed to warm air (8 min of heating, 1 min exposure, and 2.5 L/min air flow rate). Statistical significance (p ≤ 0.05) indicated by: c: within group comparison of bsl with 1st; d: 1st with 2nd; e: bsl with 2nd (t-tests for dependent samples). (C) Population response of the control group (CTRL) exposed to warm air and a group exposed twice to vCOC (COC 75 μg) using our standard protocol, with the first administration at 9:00 AM and the second at 3:00 PM. Data are plotted as mean of population (32 flies) locomotor activity 5 min before and 5 min after (1st and 2nd) exposure to COC, +SEM. Statistical significance (p ≤ 0.05) indicated by: c: comparison of bsl with 1st; d: 1st with 2nd; e: bsl with 2nd (within group comparison using t-test for dependent samples). (D) Analysis of individual flies from data in part (A). Percent of individual flies in a population that show sensitivity (SENS) and locomotor sensitization (LS) in control (CTRL) and group exposed to vCOC (COC 75 μg). ∗χ2 test statistical significance p ≤ 0.05. Starting data were same as (C) from which categories increase, decrease and same were divided.
