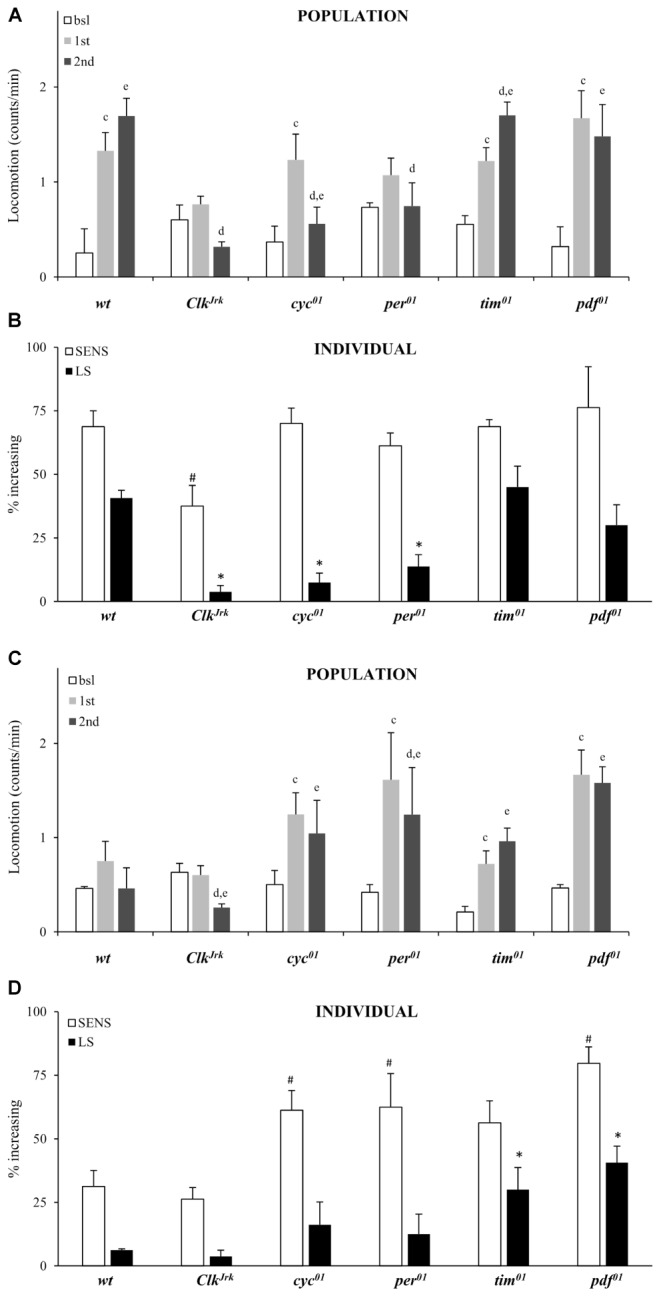
FIGURE 6.

Locomotor sensitization to vCOC depends on circadian genes. (A) Average locomotor activity of flies 5 min before drug exposures (bsl), 5 min after first exposure (first) and 5 min after second (second) exposure to 75 μg of vCOC given 6 h apart. Fly populations were either wild type (wt) or mutant for circadian genes ClkJrk, per01, cyc01, tim01 and pdf01 (n = 32 for each group). Statistical significance (p ≤ 0.05) indicated by: c: comparison of baseline to after first administration; d: after first to after second and e: baseline to after second administration (all within the group using t-test for dependent samples). (B) Percentage of individual flies showing sensitivity or increasing locomotor activity to the first exposure of vCOC (bsl vs. 1st) and flies showing further increase in locomotor activity to the second exposure (LS) (bsl vs. 1st vs. 2nd). χ2 test showed statistical significance p ≤ 0.05 for comparison of wt to mutants in SENS (#) and (∗) LS. Starting data were same as (A) from which categories increase, decrease and same were divided. (C) Average locomotor activity (counts/min) during baseline, 5 min before exposures (bsl), 5 min after first exposure (1st) and 5 min after second (2nd) exposure to warm air flow (2.5 L/min, for 1 min after 8 min of heating), given 6 h apart. Fly populations were either wild type (wt) or mutants for circadian genes ClkJrk, per01, cyc01, tim01, and pdf01 (n = 32 for each group). Statistical significance (p ≤ 0.05) indicated by: c: comparison of baseline activity to after first administration; d: comparison of activity after first and second exposures; e: comparison of baseline activity to after second administration. All tests were within the group, using t-test for dependent samples. (D) Percentage of individual flies showing sensitivity or increased locomotor activity to a first exposure to warm air flow (2.5 L/min, for 1 min after 8 min of heating) and flies showing further increase in locomotor activity to a second exposure (LS). χ2 test showed statistical significance (p ≤ 0.05) for comparison of wt to mutants in SENS (#) and (∗) LS. Starting data were same as (C) from which categories increase, decrease and same were divided.
