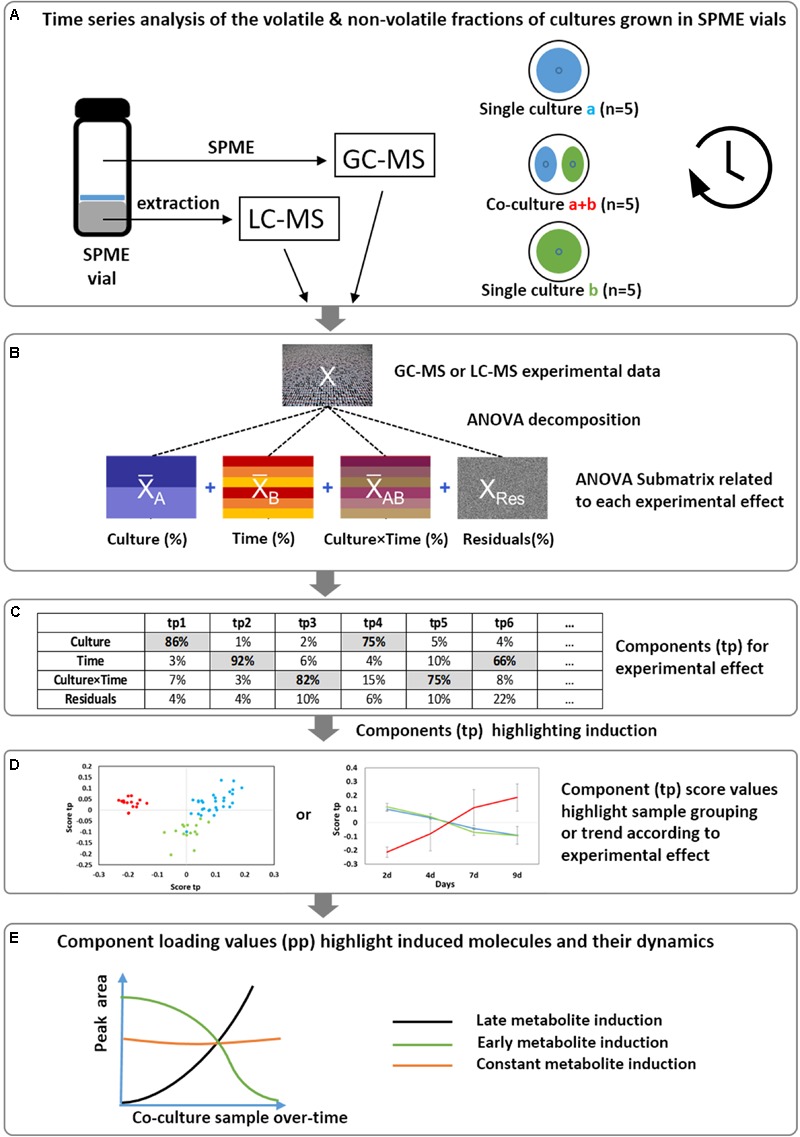
FIGURE 1.

Overview of the implemented strategy to reveal the induction of volatile and non-volatile molecules and highlight their dynamics. (A) Fungal single cultures and co-cultures are grown directly in SPME vials and analyzed at different time points. The volatile fraction is directly analyzed by head-space GC-MS, while the whole culture medium is profiled by LC-HRMS after solvent extraction. Two different and independent datasets are obtained. (B) An AMOPLS model is applied separately to GC-MS and LC-MS datasets starting with the decomposition of the matrix (X) in a series of submatrices (Xi) according to the experimental design (Culture, Time, Culture × Time). (C) The relative variability of each main effect can be assessed by computing the sum of squares of the submatrices. (D) The submatrices are analyzed using a multiblock OPLS model. AMOPLS separates the sources of variability related to the experimental factors with dedicated predictive score (tp) and loading values (pp), from the orthogonal components summarizing unexplained variations. (E) The components loading values highlight induced molecules with respect to the different experimental factors.
