
FIGURE 2.
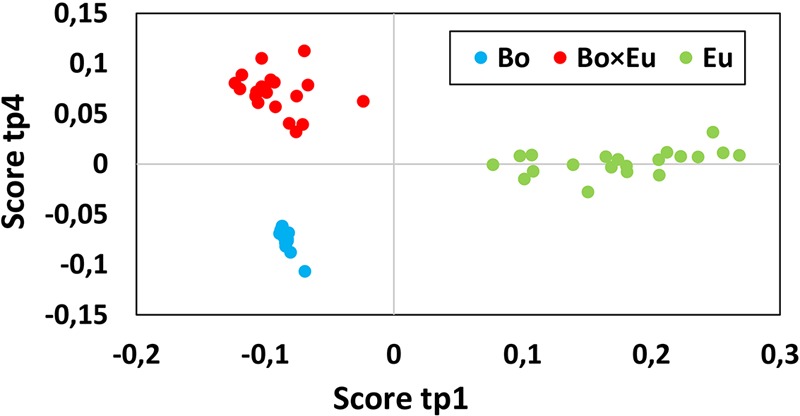
The score plot of the predictive component tp1 (horizontal axis) and tp4 (vertical axis) associated with the Culture effect for the volatile dataset. Clusters related to single cultures (blue dots for B. obtusa and green dots for E. lata) and co-cultures (red dots) are clearly separated. Calculated variance is 25.1% for tp1 and 12% for tp4. Co-culture samples present a negative score value on tp1 and a positive score value on tp4.