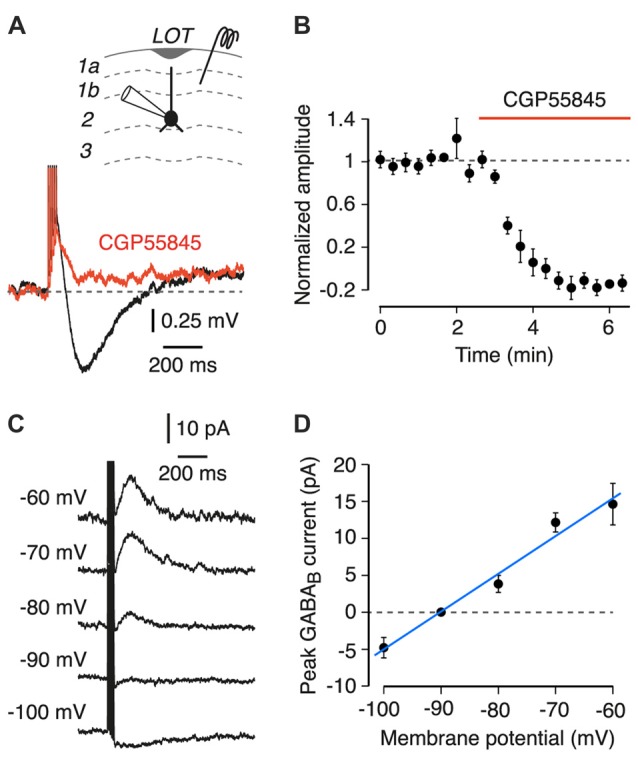
Figure 1.

Properties of a postsynaptic GABAB receptor-mediated response in semilunar (SL) and superficial pyramidal (SP) cells in layer 2 of the piriform cortex (PC). Inset at top shows a schematic of the experiment configuration. LOT, lateral olfactory tract. (A) Layer 1 stimulation (five pulses at 100 Hz) evokes a slow hyperpolarization (black trace) that is blocked by 5 μM CGP55845 (red; each trace is an average of 10 episodes; SP cell shown). (B) Mean peak amplitude of the postsynaptic GABAB receptor response, normalized to the mean amplitude during the baseline period, plotted vs. time (n = 7 SL and SP cells). Normalized amplitude decreases after bath application of CGP55845 (red bar). Error bars show ± SEM. (C) Typical voltage-clamp experiment for determining the reversal potential of the GABAB-mediated postsynaptic current. Each trace is an average of four episodes, each at the indicated holding potential. Stimulus as in (A). Data are from an SP cell. (D) Mean current-voltage plot for the cell in (C). Blue line is a linear fit, giving an estimated reversal potential of −91 mV in this example. Error bars show ± SD.
