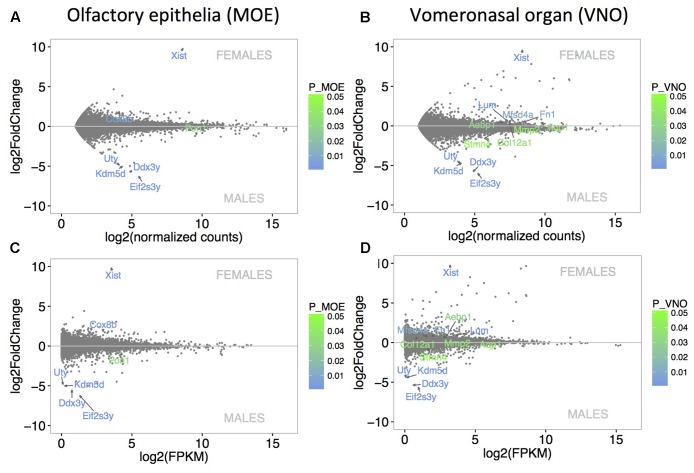
FIGURE 2.
Analysis of differentially expressed genes. MA plots demonstrate that the level of sexual dimorphism is extremely low in MOE (A) and VNO (B) with only few data points being significant sexually dimorphic. Similar pattern of low sexual dimorphism is also visualized using FPKM values in (C) MOE and (D) VNO. X-axis represent the basal mean of normalized counts (A,B) or FPKM (C,D), while the Y-axis represents particular fold differences. The level of significance (males vs. females) is scaled from green (p < 0.05) to blue (p < 0.01) and only significant points are annotated with transcript names.

