
FIGURE 5.
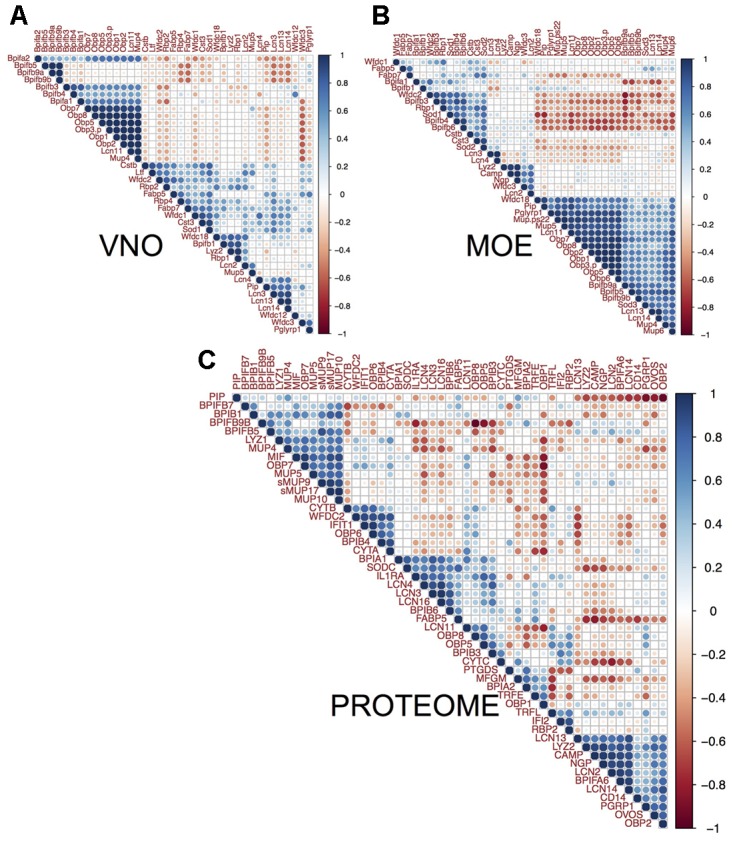
Correlation between lipocalins and antimicrobial proteins. We compared individual patterns of protein abundances. The three multiple correlation plots (correlated from –1 to 1 scaled from red to blue) – produced by hierarchical clustering with complete linkage method and Euclidean distance in (A) VNO, (B) MOE, and (C) the nasal cavity proteome – demonstrate that MUPs and OBPs reach the highest correlation with the levels of particular BPI proteins. Levels of Bpifa1, Bpifa2, Bpifb3, and Bpifb4 significantly correlate with Obp1, Obp2, Obp7, Obp8, Lcn11, and Mup4 in VNO (A). Levels of Bpifb9a, Bpifb9b, and Wfdc18 correlate with all Obps, Mup4, Mup5, and Mup6 in OE (B). On the level of proteome (C), MUPs (i.e., central sMUP9, MUP10, sMUP17, and outlier – MUP4 and MUP5) and OBP7 are correlated with antimicrobial LYZ1, BPIB1, BPIFB5, and to some extent with BPIFB7 and BPIFB9B. OBP2, LCN13, LCN14, and the bacterial-siderophore scavenging LCN2 are correlated with BPIFA6, LYZ2, and natural antibiotics CAMP (cathelicidin) and NGP (bectenecin). LCN3, LCN4, and LCN16 are correlated with BPIA1 and BPIB6. The bigger the circle the smaller is particular p-value (p < 0.05).