
FIGURE 2.
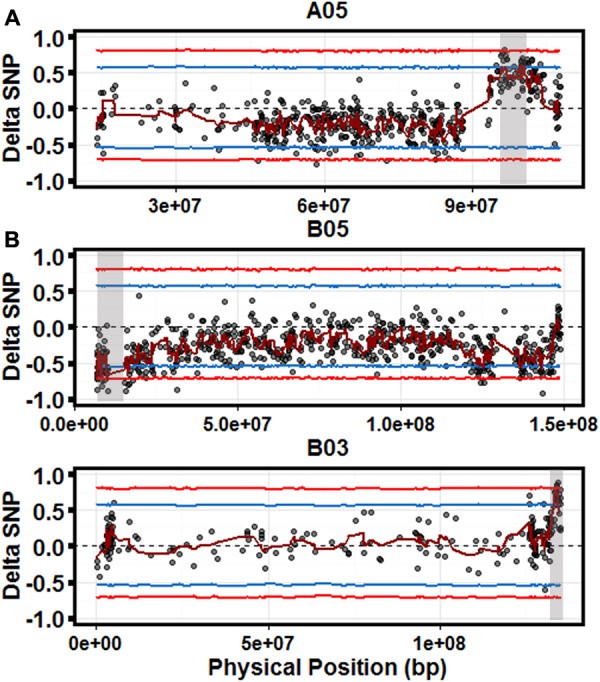
Quantitative trait loci (QTL)-seq identifies significant QTL for controlling LLS resistance. Scatter plots for chromosomes A05 (top), B05 (middle), and B03 (bottom). Each graph is a scatter plot of each ΔSNP (R-Bulk SNP Index–S-Bulk SNP Index) plotted against the physical position based on the A. duranensis (A) and A. ipaensis (B) pseudomolecules. The dark red line represents a sliding window of 2 Mb moving 500 kb intervals. Statistical confidence intervals under the null hypothesis of no QTL are plotted for each marker (blue – p < 0.05 and red – p < 0.01). Gray shaded boxes indicate significant QTL.