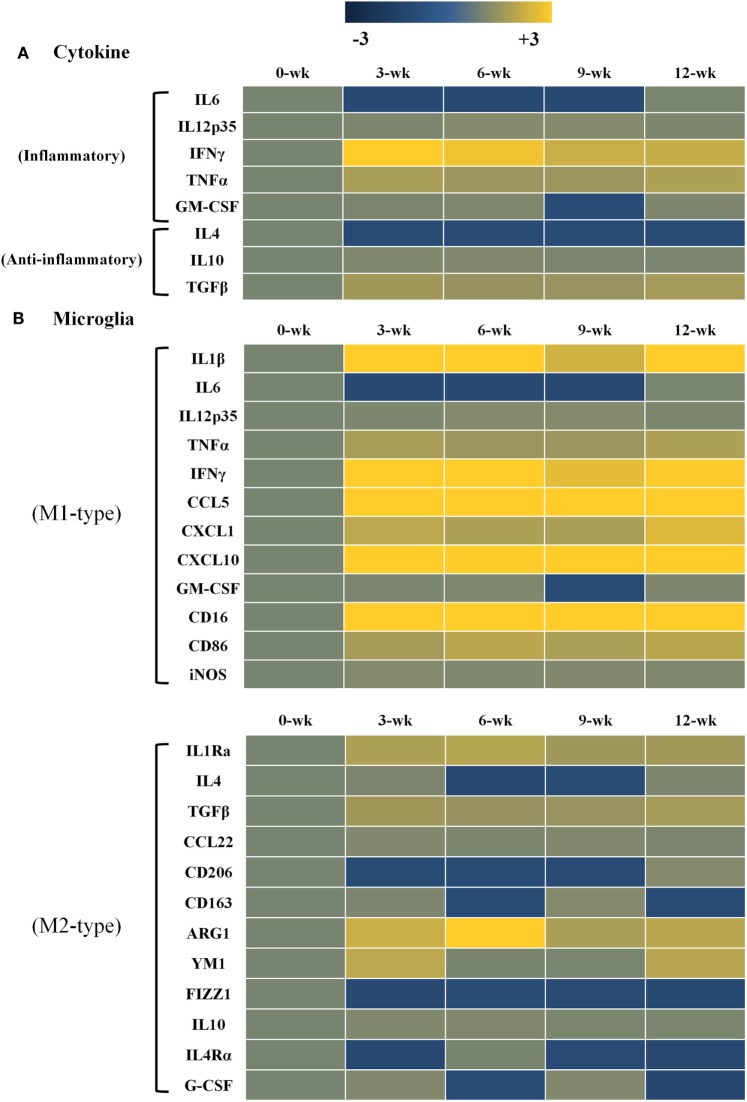
Figure 3.
Heat maps representing cytokine and chemokine concentrations in the inflammatory immune response and microglia phenotypes. Transcript levels of inflammatory and anti-inflammatory cytokines as well as microglia phenotype markers were measured in Toxoplasma gondii-infected mouse brains using microarray analysis. Each row of the heat map represents cytokines related with inflammatory and anti-inflammatory responses (A) as well as microglia phenotype markers related with the M1-type and M2-type (B). Each column represents infection times from week 0 to 12 postinfection. The color scale corresponds to the relative expression of the cytokine for the minimum (−3) and maximum (+3) of all values.

