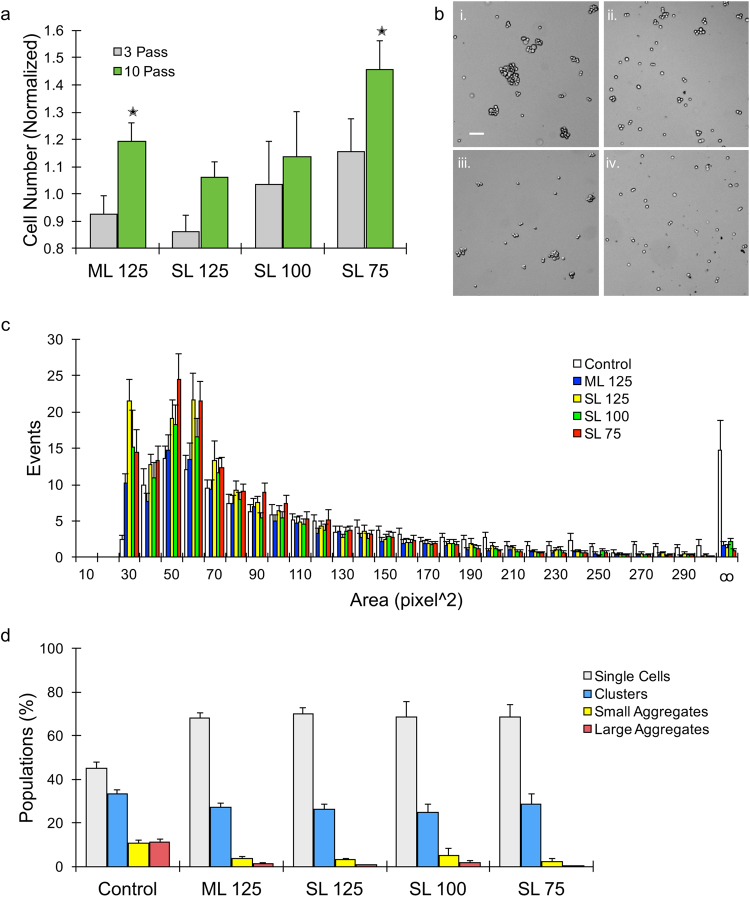
Figure 2.
Evaluation of single layer devices at different channel widths. (a) MCF7 breast cancer cells recovered in device effluents were quantified and normalized by the initial value prior to device processing. The original multilayer (ML) device significantly improved single cell yield after 10 passes, but this was not seen in the single layer (SL) device with the same channel dimensions (125 µm). However, decreasing channel width improved performance, with the SL device with 75 µm width exceeding the ML case. (b) Micrographs showing cell suspensions (i) prior to device processing and (ii-iv) after passing 10 times through the (ii) ML, (iii) SL 125, and (iv) SL 75 devices. Scale bar is 100 μm. (c) Cell unit area histogram determined by analyzing micrographs, leading to classification of single cells (<80 pixels2 and aspect ratio <1.2), clusters (80 to 200 pixels2 and aspect ratio >1.2; 2–3 cells), small aggregates (200 to 300 pixels2, 4–10 cells), and large aggregates (>300 pixels2, >10 cells). Data was combined between 3 and 10 pass conditions. (d) Cell populations above plotted as percent total for the control, ML device, and various SL devices after 10 passes. Device processing eliminated almost all large aggregates and most small aggregates, leading to higher single cell purity. Clusters only decreased slightly. Error bars represent standard errors from at least three independent experiments. *indicates p < 0.05 relative to non-device processed control (value = 1).

