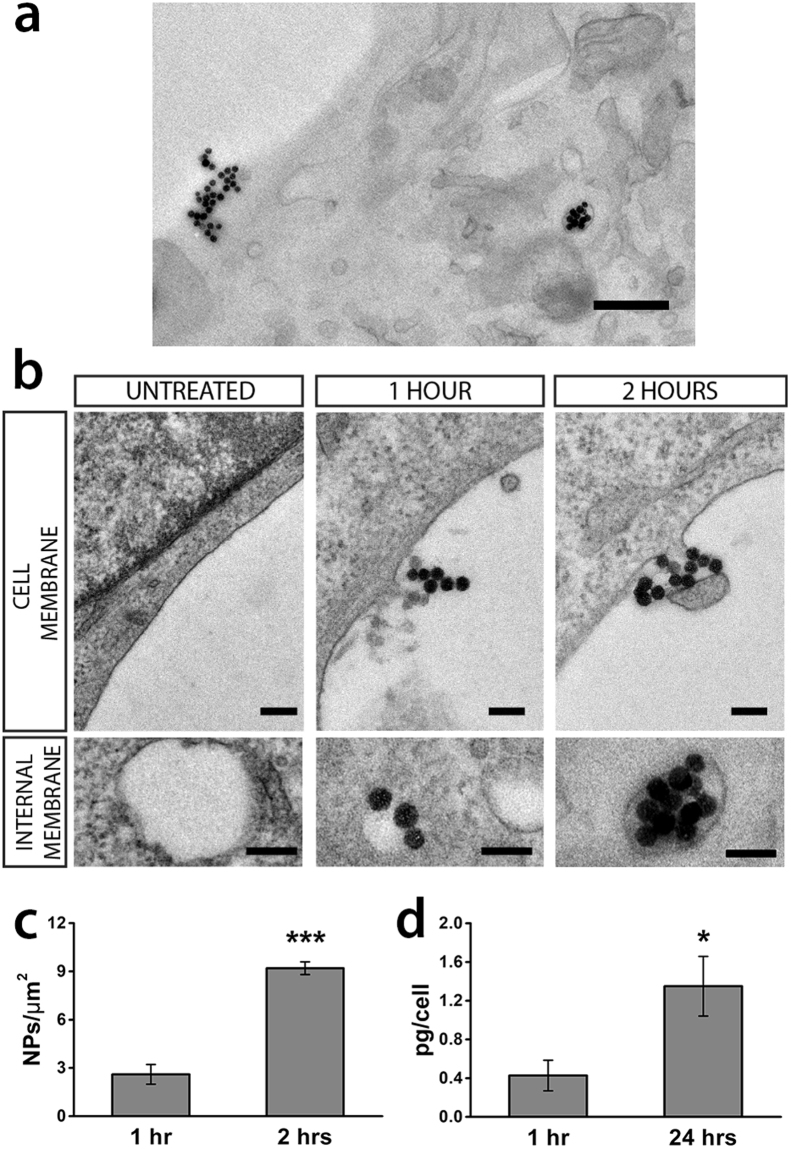
Figure 2.
Interaction with the plasmamembrane of GT1-7 cells and internalization of 50 nm SiO2 NPs. (a) Low magnification TEM image of a GT1-7 cell with NPs on the plasmamembrane and in a vescicle (2 hours incubation). Scale bar: 500 nm. (b) After either 1 or 2 hours of incubation, small agglomerates of NPs could be observed in association with the plasmamembrane; some of them were already incorporated into endocytic vesicles. Scale bars: 100 nm. (c) NPs density obtained by TEM images at 1 and 2 hrs of incubation. Mann-Whitney U test; ***p < 0.0001 two-tailed, n = 3. (d) Quantitative assessment of internalization at 1 and 24 hours of incubation by means of ICP-MS. t-test, *p = 0.037 two-tailed, n = 4.

