Figure 2.
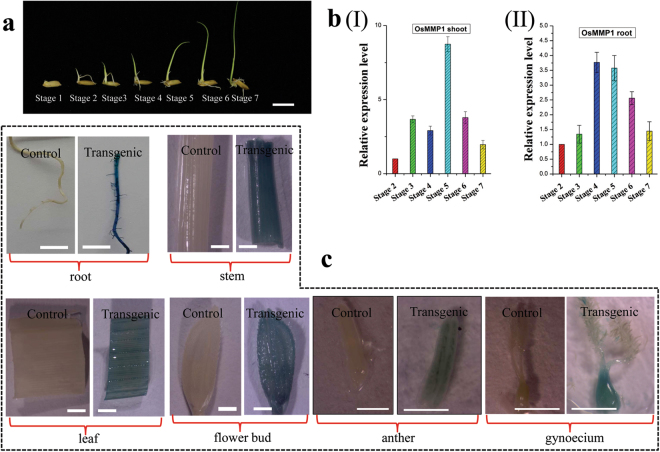
Spatio-temporal expression profile of OsMMP1 gene. (a) Photograph shows developmental stages of rice seedlings harvested for RNA isolation. Scale bars = 10 mm. (bI,II) Stage-wise relative quantification of the OsMMP1 gene expression in rice shoot and root tissues by qRT-PCR. Gene expression data were normalized against the internal control rice actin1 gene and calculated relative to the stage 2 expression value that was taken as one. (c) Micrographs of the OsMMP1 promoter-driven GUS reporter expression in transgenic rice lines show GUS activity in root, stem, leaf, flower bud, anther, and gynoecium. All the lines of OsMMP1promoter:GUS transgenic rice were tested for GUS reporter expression, and were found to be consistently GUS positive in the tissues examined. They were also tested in different generations (T0 − T3). Here, all the GUS positive panels are from one transgenic line of T3 generation for proper representation. Scale bar for root = 50 mm, stem = 10 mm, leaf = 10 mm, flower bud = 10 mm, anther = 1 mm, and gynoecium = 1 mm. In all bar graphs, data are expressed as mean ± SD (n = 3).

