Figure 5.
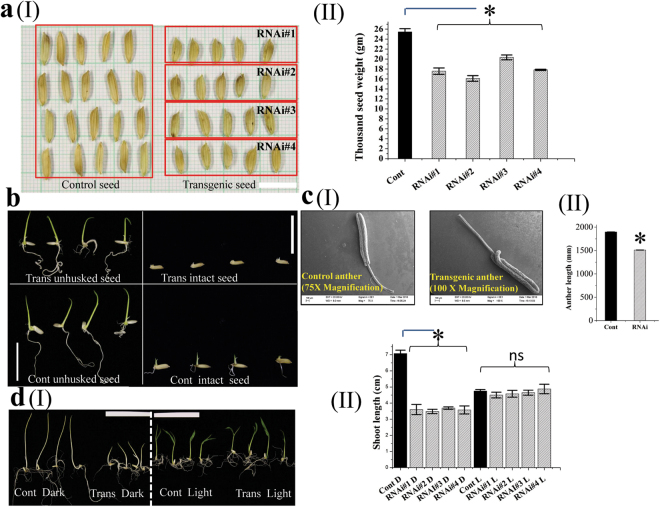
Endogenous OsMMP1 gene silencing affects developmental phenotypes in transgenic (Trans) rice compared with the non-transgenic control (Cont) plant. (aI) Photograph shows smaller grain size in transgenic rice lines. Scale bar = 10 mm. (aII) Comparison of thousand seed weight (gram) in control and transgenic rice lines. (b) Photographs show the comparison of germination capability of intact and dehusked rice grains. Scale bar = 20 mm. (cI) Scanning electron micrographs show shorter anther length in transgenic rice lines. The images were visualized using Zeiss EVO 60 scanning electron microscope. (cII) Comparison of anther length in control and transgenic rice lines. (dI) Photographs show the variation of seedling growth in transgenic and control rice lines under the dark (D) and light (L) conditions. Scale bar = 55 mm. (dII) Comparison shows the shoot length is shorter in transgenic lines relative to the control under the dark (D) condition, but not significantly altered under the light (L) condition. In all bar graphs, data are expressed as mean ± SE of 3 set observations (each transgenic line) for (aII); as mean ± SE of 16 observations (randomly from all transgenic lines) for (cII); as mean ± SE of 4 observations (each transgenic line) for (dII). Data are subjected to Student’s t-test: *P < 0.05 for (aII), (bII) and (cII). There is no significant difference between non-transgenic control and transgenic plant grown under light. ns, not significant.

