Figure 7.
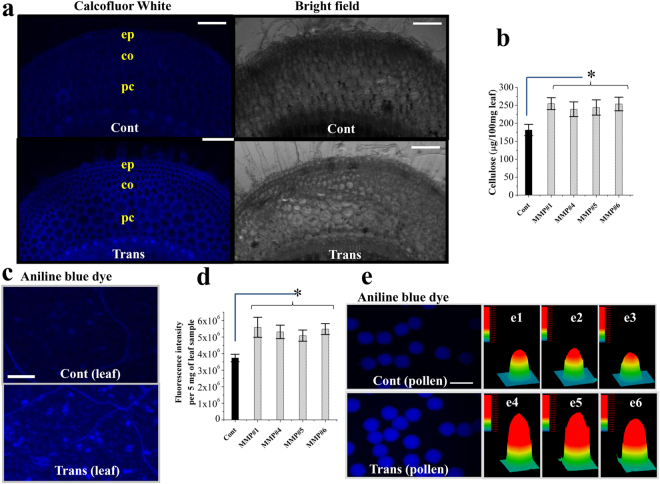
Qualitative and quantitative analyses of two cell wall constituents - cellulose and callose in transgenic (Trans) and non-transgenic control (Cont) tobacco plants. (a) Fluorescence micrographs show higher cellulose deposition in transgenic tobacco lines as revealed by Calcofluor White staining of stem cross sections. ep, epidermis; co, collenchyma; pc, parenchyma. Scale bar = 200 µm. (b) Comparison of the cellulose content (measured by anthrone test) in leaf tissue of fully grown control and transgenic plants. (c) Fluorescence micrographs exhibit higher callose deposition in transgenic lines as revealed by aniline blue staining of leaf samples. Scale bar = 100 µm. (d) Comparison of the callose content (fluorimetric quantification) in the leaf sample of fully grown control and transgenic plants. (e) Fluorescence micrographs show higher callose deposition in pollens of transgenic lines after aniline blue staining. Scale bar = 50 µm. (e1–3 and e4–6) 3D surface plot images (by Image-Pro DISCOVERY software) of pollens represent fluorescence intensity of individual pollen after aniline blue staining. Fluorescence intensity is indicated by different color and height in the 3D surface plot. Fluorescence intensity is higher in transgenic pollens compared to control pollens. In all bar graphs, data are expressed as mean ± SE of 8 observations (each transgenic line) for (b) and as mean ± SE of 3 observations (each transgenic line) for (d). Data are subjected to Student’s t-test: *P < 0.05 for (b) and (d). For each sample type, micrograph was taken with the same exposure setting.

