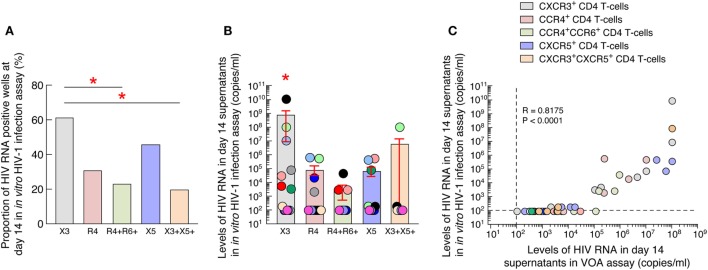
Figure 4.
Blood CXCR3+ CD4 T cells of antiretroviral therapy (ART)-treated aviremic HIV-1-infected individuals represent the major source of infectious HIV-1 in blood. (A) Proportion of HIV-1-infected individuals with detectable HIV-1 RNA (≥200 HIV-1 RNA copies/mL) in the in vitro HIV-1 infection assay. (B) Levels of HIV-1 RNA in blood memory CD4 T cell populations at day 14 of in vitro HIV-1 infection assay (N = 13). (C) Correlation between HIV-1 RNA levels measured in VOA and in in vitro HIV-1 infection assay in supernatants of blood memory CD4 T-cell populations (N = 13). Undetectable values were arbitrarily defined as 100 HIV-1 RNA copies/mL (B,C). Each individual is uniquely color coded in (B). Each CD4 T-cell population is uniquely colored in (C). Histograms correspond to mean (A,B); red bars correspond to SEM (B). “X3” corresponds to blood CXCR3-expressing CD4 T cells; “R4” corresponds to blood CCR4-expressing CD4 T cells; R4+R6+ corresponds to blood CCR4+CCR6+ CD4 T cells; “X5” corresponds to blood CXCR5-expressing CD4 T cells; And X3+X5+ corresponds to blood CXCR3+CXCR5+ CD4 T cells. Red stars indicate statistical significance (P < 0.05) (A,B). Statistical significance (P-values) was either obtained using two-tailed Chi-square analysis for comparison of positive proportions (A) or using one-way ANOVA (Kruskal–Wallis test) followed by Wilcoxon matched-pairs two-tailed signed rank test (B) or Spearman rank test for correlation (C).

