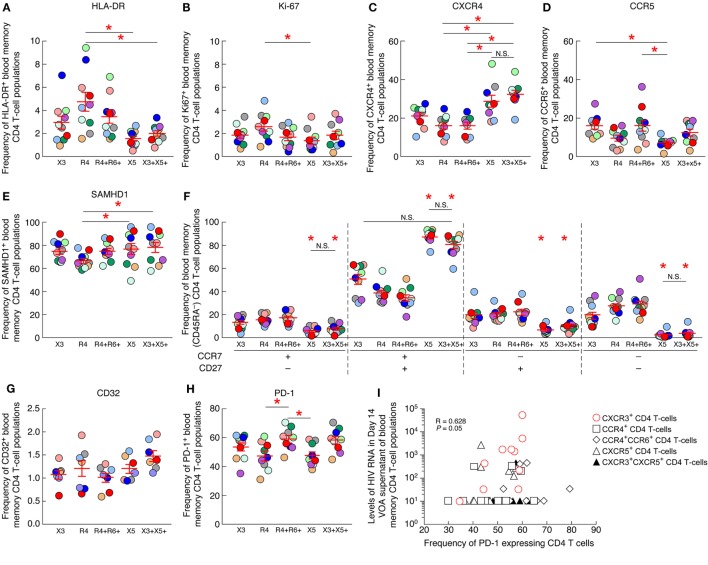
Figure 6.
PD-1 expression on blood CXCR3+ CD4 T cells positively correlates with the levels of HIV-1 RNA produced in the virus outgrowth assay (VOA) culture supernatants. Percentage of expression of HLA-DR (A), Ki-67 (B), CXCR4 (C), CCR5 (D), SAMHD1 (E) on chemokine receptor expressing blood memory (CD45RA−) CD4 T-cell populations isolated from aviremic long-term-treated HIV-1-infected individuals (N = 10). (F) Differentiation profile of chemokine receptor expressing blood memory (CD45RA−) CD4 T-cell populations isolated from aviremic long-term-treated HIV-1-infected individuals (N = 10). Percentage of CD32+ (N = 7) (G) or PD-1+ (N = 10) (H) chemokine receptor expressing blood memory (CD45RA−) CD4 T-cell populations isolated from aviremic long-term-treated HIV-1-infected individuals. (I) Correlation between HIV-1 RNA levels detected in day 14 VOA supernatants of chemokine receptor expressing blood memory CD4 T-cell populations and the percentage of PD-1-expressing CD4 T cells within each chemokine receptor expressing blood memory CD4 T-cell population. Undetectable values were arbitrarily defined as 10 HIV-1 RNA copies/mL (I). Red bars correspond to SEM (A–H). “X3” corresponds to blood CXCR3-expressing CD4 T cells; “R4” corresponds to blood CCR4-expressing CD4 T cells; R4+R6+ corresponds to blood CCR4+CCR6+ CD4 T cells; “X5” corresponds to blood CXCR5-expressing CD4 T cells; And X3+X5+ corresponds to blood CXCR3+CXCR5+ CD4 T cells. Each HIV-infected individual was color coded (A–H). Red stars indicate statistical significance (P < 0.05) (A–H). Statistical significance (P-values) was either obtained using one-way ANOVA (Kruskal–Wallis test) followed by Wilcoxon matched-pairs two-tailed signed rank test (A–H) or Spearman rank test for correlation (I).

