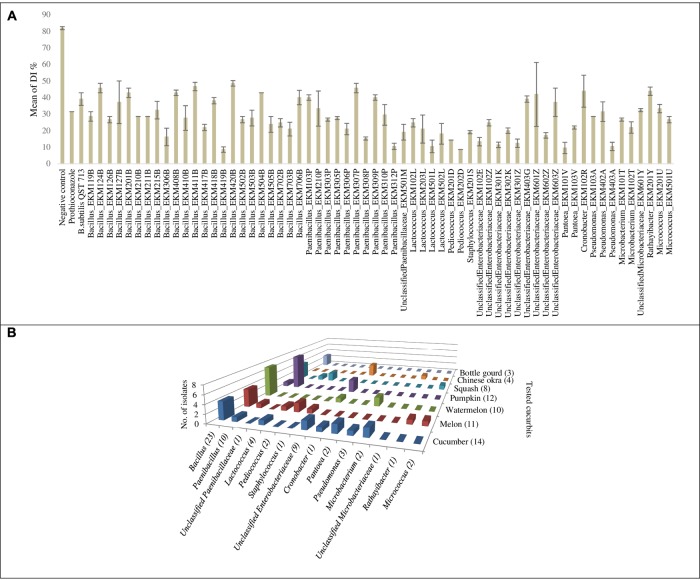
FIGURE 5.
Graphical representation for endophytic bacteria that exhibited significant suppression of powdery mildew in the leaf disk bioassay: (A) Graphical representation of calculated means of the disease index percentage (DI%) displayed by controls and endophytic bacteria that exhibited significant suppression of powdery mildew (p < 0.05) in the leaf disk bioassay. Error bars show the standard error of mean (SEM). (B) Graph chart summarizing endophytic bacterial genera that exhibited significant suppression of powdery mildew symptoms at p < 0.05, cross referenced with the original endophyte seed sources. Numbers between brackets displayed on the horizontal axis denote the total number of strains in each corresponding bacterial genus that showed antagonism. Numbers between brackets displayed on the depth axis denote the total number of strains identified from each corresponding cucurbit crop that showed antagonism. For detailed information by endophyte strain, see Supplementary Tables S3, S4.

