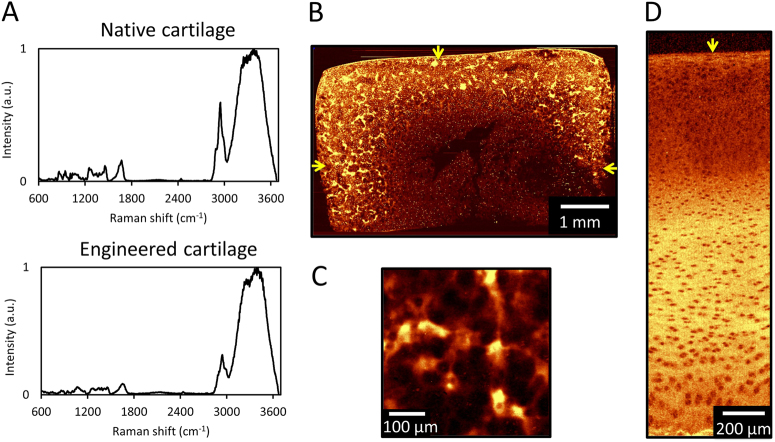
Fig. 1.
(a) Raw spectra of native and engineered cartilage. Raman spectroscopic image (univariate analysis) of ECM heterogeneities in 56-day cultured large engineered cartilage tissue construct (∅6 mm × 3 mm) for (b) the full cross-section (10 μm spatial resolution) and (c) a localized peripheral region (1 μm resolution). Arrows represent media-exposed surfaces. (d) Raman spectroscopic image of natural depth dependent ECM heterogeneities in native articular cartilage (10 μm resolution). Arrow represents articular surface

