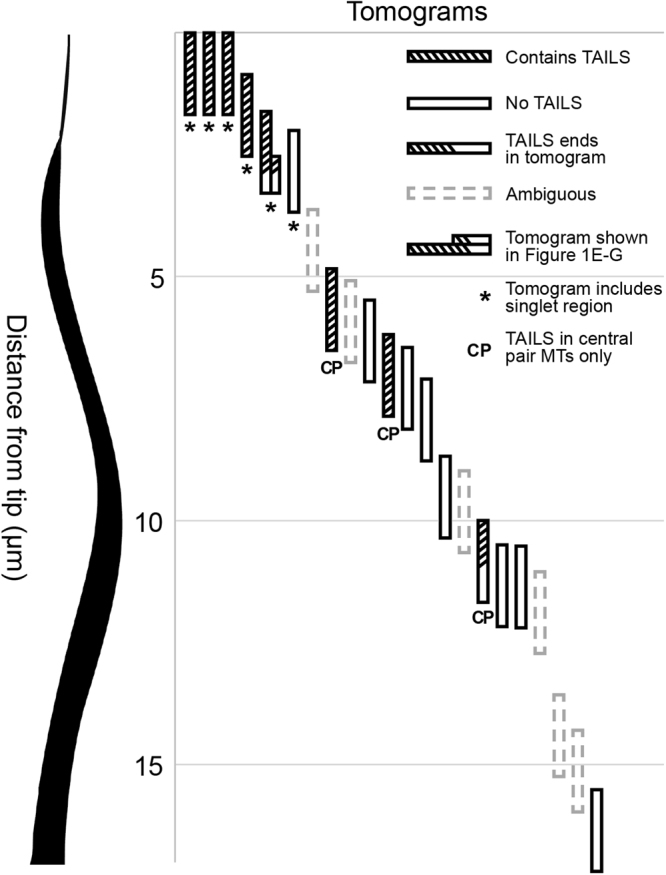
Figure 2.

TAILS localize to microtubule plus ends. Each vertical bar represents a tomogram where the presence of the TAILS complex is illustrated with stripes. Empty bars indicate that TAILS was absent and dashed bars indicate that the quality of the tomogram did not allow determination of neither presence nor absence of TAILS. Half-striped bars show that TAILS was partially present. Bars labelled with an asterisk represent that the tomogram included the flagellar singlet region, while bars labelled with CP mean that the data refers to central pair microtubules. On one occasion only (fifth tomogram from the left, also shown in Fig. 1E–G) TAILS was observed in dMTs and it ended halfway through the tomogram.
