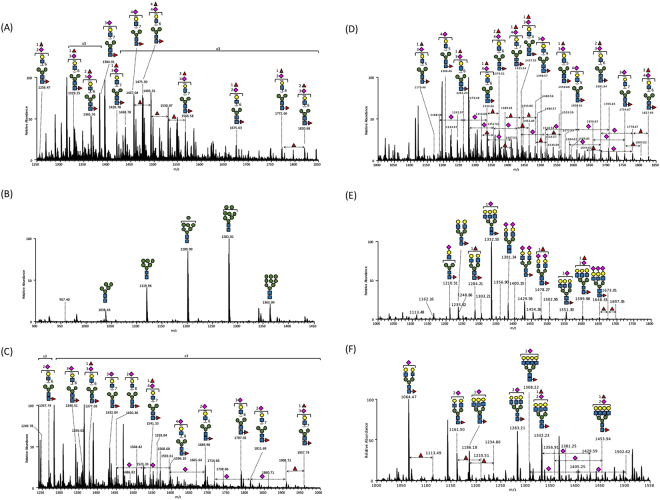
Figure 2.
MS profiling of site-specific glycoforms of the serum sFcγRIIIb, covering six N-glycosylation sites. (A) Asn38, (B) Asn45, (C) Asn64, (D) Asn74, (E) Asn162, and (F) Asn169. The spectra are based on the averaged mass scans of the glycopeptides containing individual N-glycosylation sites, which eluted in time ranges of (A) 27.8–29.1 min, (B) 32.7–33.4 min, (C) 31.0–33.8 min, (D) 21.8–24.8 min, (E) 32.0–39.0 min, and (F) 44.0–50.0 min. The identities of Man, Gal, Fuc, and GlcNAc were inferred from the literature and are represented by symbols according to the Symbol Nomenclature for Glycans (SNFG) system40, the details of which can be found at NCBI (http://www.ncbi.nlm.nih.gov/books/NBK310273/): GlcNAc,  ; Man,
  ; Gal,
  ; Neu5Ac,
  ; Fuc,
  .
.

