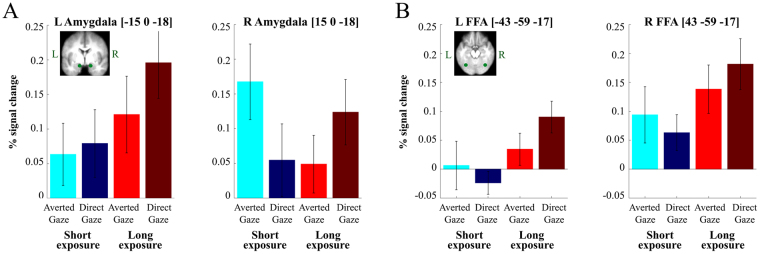
Figure 2.
Results from Experiment 1 (fMRI study). (A) Shows the percent change in the BOLD signal in bilateral amygdala (left = left hemisphere, right = right hemisphere) in response to brief (blue colors) and long (red colors) to clear threat cues (brighter colors) and ambiguous threat cues (darker colors). (B) Shows the percent change in the BOLD signal in bilateral Fusiform Face Area (FFA) (left = left hemisphere, right = right hemisphere) in response to brief (blue colors) and long (red colors) to clear threat cues (brighter colors) and ambiguous threat cues (darker colors). Note for both (A) and (B), that a clear threat cue is represented by a fearful face with averted eye-gaze and an ambiguous threat cue is represented by a fearful face with direct eye-gaze.

