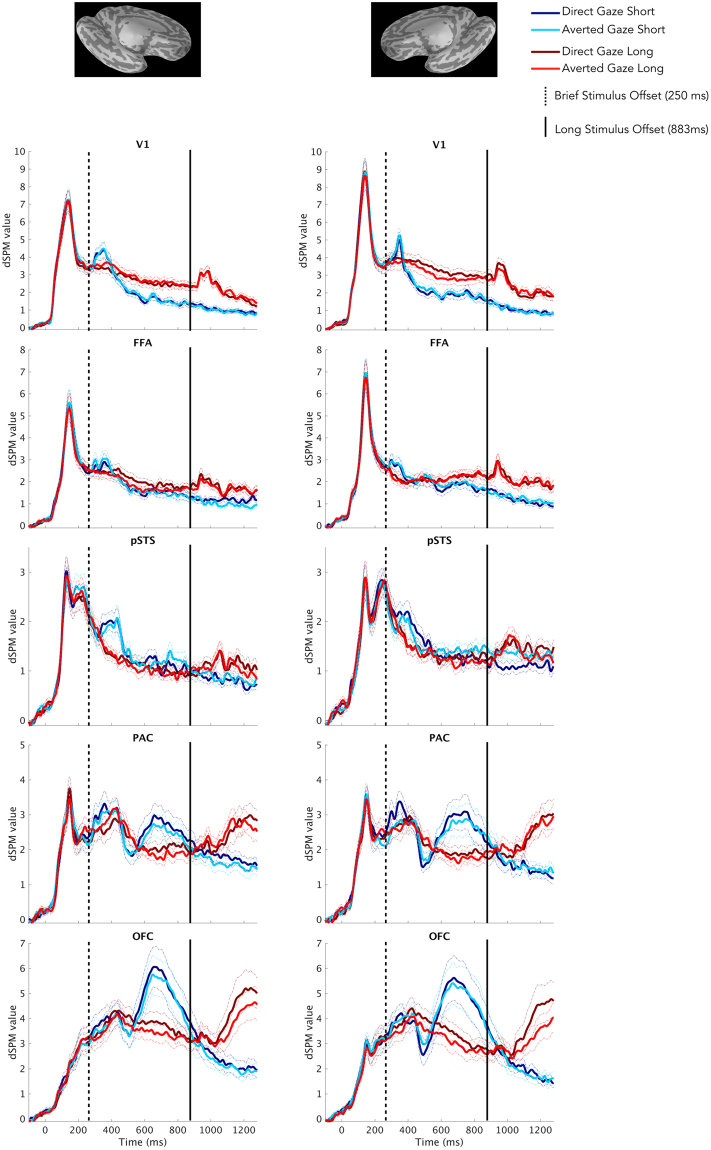
Figure 3.
Time courses of activation within Regions of Interest (ROIs). Time courses depicting bilateral (Left = Left Hemisphere, Right = Right Hemisphere) activation (measured by dSPM values) for both exposure durations (blue = short, red = long) and both threat cue types (brighter shades = averted gaze [“clear” threat], darker shades = direct gaze [“ambiguous” threat]) in our Regions of Interest (ROIs). Standard Error from the Mean (SEM) is represented by dashed lines of the same color above and below the respective time series. The dashed black line indicates stimulus offset for brief exposures (250 ms) while the solid black line indicates stimulus offset for long exposures (883 ms).

