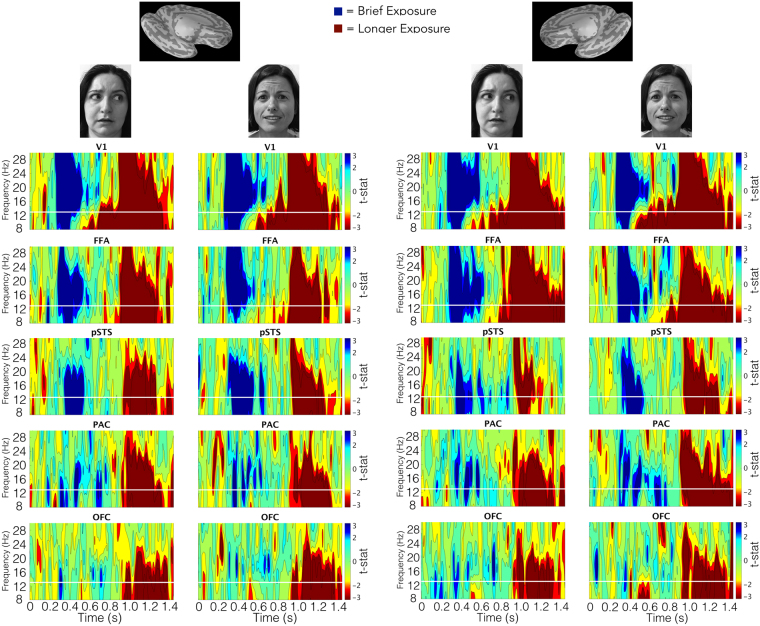
Figure 4.
Unthresholded statistical maps of brief -versus longer-exposure phase locking across trials by threat cue type. The left side shows maps for each ROI from the left hemisphere according to the threat type conveyed by the face at the top of the column (averted-gaze = clear threat, direct-gaze = ambiguous threat). The right side shows the same for the right hemisphere. For each map, the y-axis represents frequency (in Hz) while the x-axis represents time (in s) while the pixel value is the t-statistic representing each participant’s PLF (Phase-locking Factor) across trials for brief exposures (represented in blue) compared to long exposures (represented in red). Contour levels map to significance based on a two-tailed distribution with 59 degrees of freedom. Green represents no significance (i.e. p-values above 0.05). The three blue shades (cyan, blue, dark/navy blue) represent p-value ranges between 0.05–0.01, 0.01–0.001, and 0.001 and below for brief exposures. The three red shades (yellow, red, dark red) represent the same p-values for long exposures. All p-values parametric and uncorrected.

