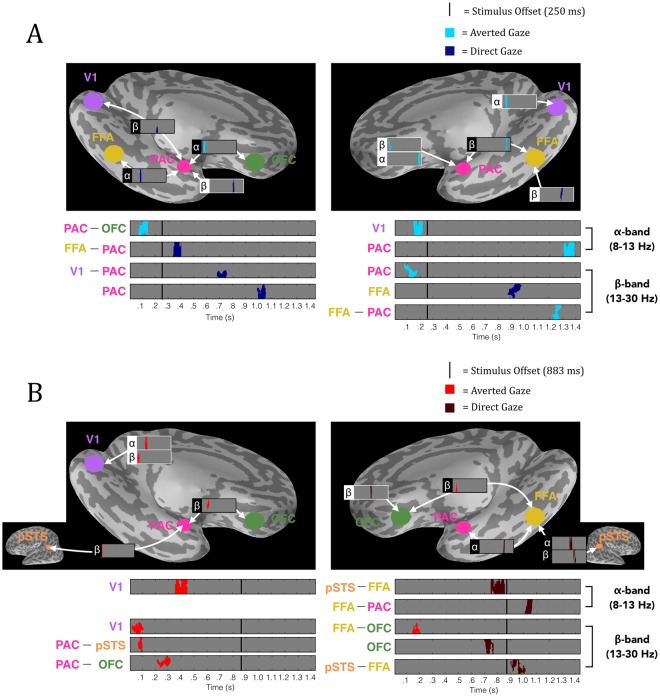
Figure 5.
Significant phase locking for averted vs. direct gaze fearful faces in the extended face-processing network. (A) Significant phase locking for averted-gaze (bright blue) vs. direct-gaze (dark blue) fearful faces during brief exposures (250 ms). (B) Significant phase locking for averted gaze (bright red) vs. direct gaze (dark red) fearful faces during long exposures (883 ms). Left is the left hemisphere phase-locking network (denoted by the image of the left hemisphere). Right is the right hemisphere phase-locking network. Above is the significant phase locking overlaid on an inflated Freesurfer brain to show anatomical locations of significant phase locking. White outlines depict phase locking (PLF) within a region (i.e. phase locking across trials) while black outlines depict phase-locking values (PLV) between regions. The phase locking’s frequency band is marked by the appropriate Greek letter to the left (α = 8–13 Hz, β = 13–30 Hz). Below is the significant phase locking magnified and arranged by time of effects as well as frequency band of effects (α on top, β on bottom, as noted on the far right) to display the temporal progression of significant phase locking through the trial. The anatomical location/connection of the phase locking is noted to the left. Stimulus offset is marked by the solid black line. For all plots, grey depicts periods of non-significant phase locking while colored (see legend/A,B descriptions for color to trial type correspondence) blobs depict significant phase locking determined by non-parametric cluster permutation tests as outlined in Methods.

