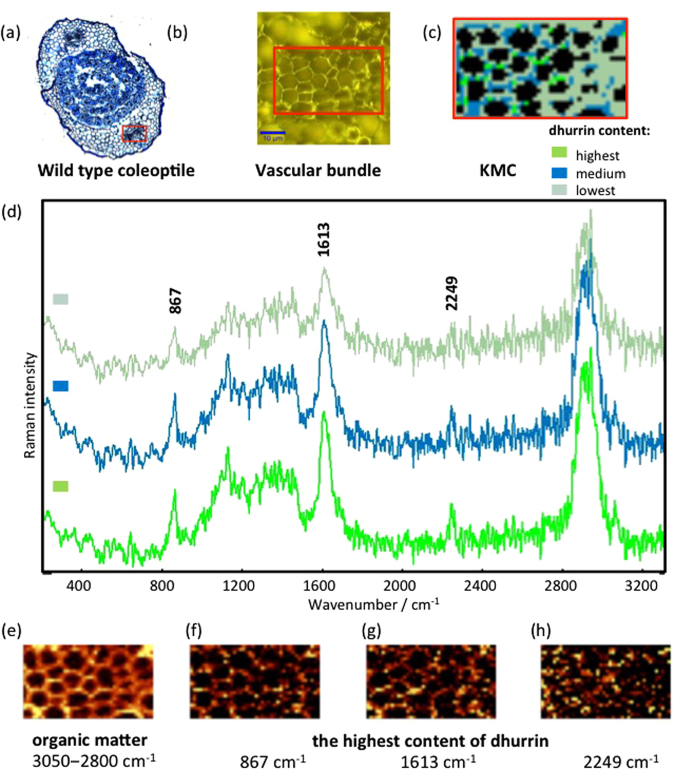
Figure 3.
(a) Micrograph of toluidine blue stained cross section of the wildtype sorghum coleoptile. (b) Visible image from Raman microscopy of the central area of the section showing the vascular bundle region with the investigated area of 42 × 24 μm as marked on panel a. (c) The KMC results, with (d) the average Raman spectra for the main classes, including highest (green), medium (blue) and lowest (grey green) dhurrin content. Raman intensities were normalized for C-H stretching region (2800–3050 cm−1) in order to compare the dhurrin content in different classes. (e–h) Integration Raman maps obtained with a sampling density of 1 µm were made for the following: (e) C-H stretching band in the region of approx. 2800‒3050 cm−1 showing organic constituents present; (f–h) the strongest bands of the dhurrin observed at 867, 1613 and 2249 cm−1, respectively. The yellow colour corresponds to the highest relative intensity of the integrated band. All material was prepared using cryosections.

