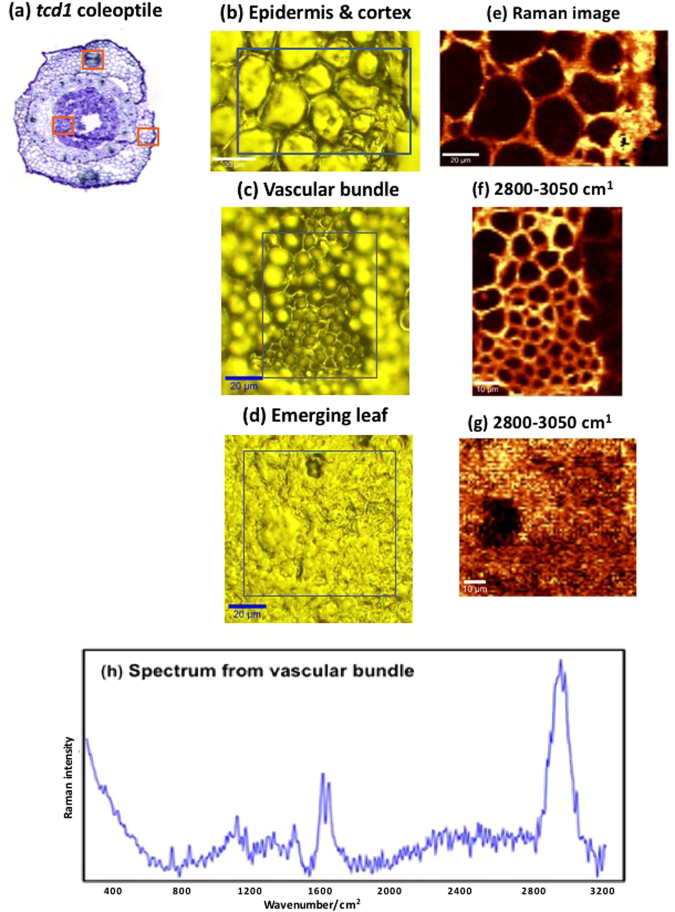
Figure 4.
(a) Toluidine blue stained image of the tcd1 coleoptile. The Raman-scanned areas are marked by red boxes. Visible images of (b) the epidermis and cortex; (c) vascular bundle; (d) emerging leaf; Corresponding Raman images (at 2800–3050 cm−1) of the three tissue types in the tcd1 coleoptile (e–g). The 2245 cm−1 nitrile (ν C≡N) band is absent in all tissues, indicating absence of dhurrin. (h) Average spectrum of 50 spectra randomly selected from the vascular bundle map. All material was prepared using cryosections.

