Figure 1.
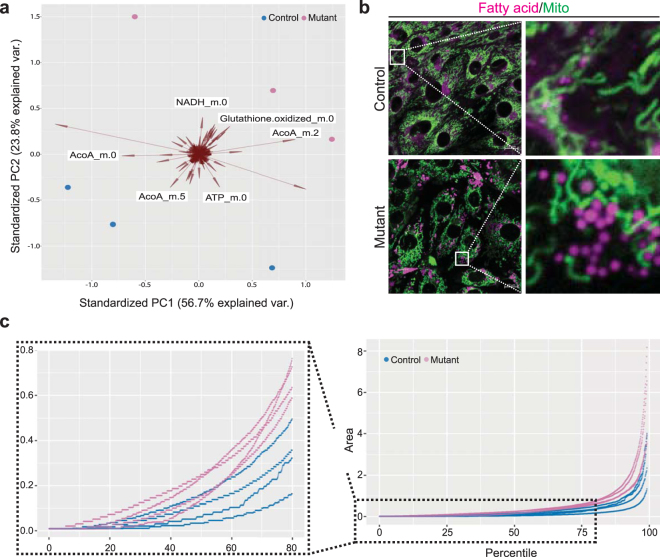
Pkd1ko/ko cells have metabolic differences. (a) Fluxomics. Principal components bi-plot showing clustering of three replicates of a mutant and control immortalized kidney epithelial cell line (94414-LTL) according to flux of 13C from labeled glucose through different metabolites. Circles are samples, and their location in the plot is determined by a linear combination of specific factors (metabolites). The direction and weight each metabolite contributes to the location of the sample is represented by the direction and size of the corresponding arrow. Mutant (red circles) and control (blue circles) samples cluster in opposite corners of the figure, and labeled arrows show the metabolites that have the highest influence in separating groups. (b) Fatty acid uptake assay showing that mutant cells have increased number and size of lipid droplets (green: mitochondria stained with MitoTracker Green; Magenta: BODIPY 558/568 C12). The panels on the right show higher magnification of the areas inside the white squares. (c) Quantile plot showing distribution of lipid droplet size quantified in ten random fields in two proximal tubule kidney cell lines (each line is one experiment for one cell line). The insert on the left shows only up to the 80th quantile, to highlight differences within the lower range of area values (n = 4 experiments, p = 0.044; line: percentile values of the lipid droplet area for one experiment, colored by genotype).

