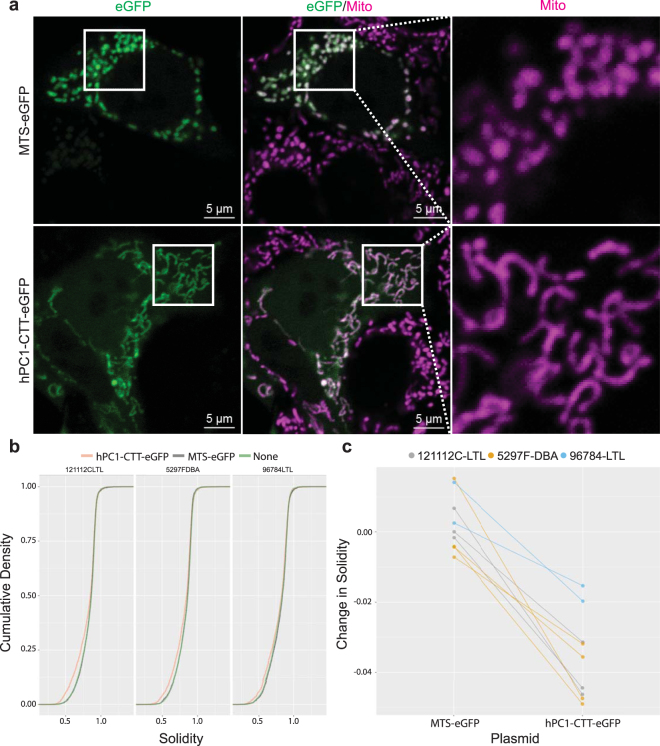
Figure 7.
PC1-CTT alters mitochondrial network structure. (a) Mutant epithelial cells transfected with hPC1-CTT-eGFP or MTS-eGFP. Transfected cells express eGFP and can be seen in the left panels. The middle panels show mitochondria stained with MitoTracker Deep Red in magenta. The area inside the solid squares is in shown on the right. Note that mitochondria appear more elongated in cells expressing PC1-CTT. (b) Cumulative density of solidity index in at least three independent experiments in three different mutant cell lines. Note that cells expressing PC1-CTT have solidity distribution shifted towards lower values. (c) For each experiment, the solidity was measured between un-transfected and transfected cells. The change in solidity at the 25th quantile was close to zero in cells expressing MTS-eGFP, but significantly lower in cells expressing PC1-CTT (p < 0.001; each line corresponds to one experiment, colored by cell line).

