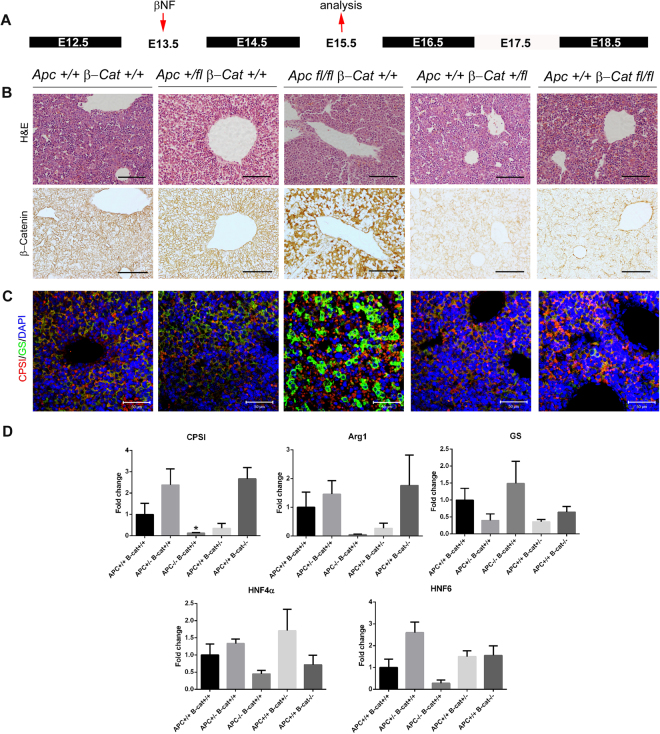
Figure 4.
Immunohistochemical and qRT-PCR analysis of E15.5 embryonic liver following recombination at E13.5. (A) Schematic illustration of treatment regime showing time point of β-naphthoflavone injection (E13.5) and time point of tissue isolation for analysis (E15.5). (B) Haematoxylin & Eosin staining and immunohistochemical staining for β-catenin in embryonic liver sections taken from AhCre+Apc+/+β-Cat+l+, AhCre+Apc+/flβ-Cat+l+, AhCre+Apcfl/flβ-Cat+l+, AhCre+Apc+/+β-Cat+lfl and AhCre+Apc+/+β-Catfllfl recombinants. (C) Immunofluorescent co-staining for CPSI (red) and GS (green) with DAPI counterstain (blue) in embryonic liver sections taken from the recombinants indicated. The magnification is x200, scale bars −50 µm. (D) qRT-PCR analysis of cDNA isolated from E15.5 embryonic liver following deletion of Apc and β-catenin at E13.5. Statistical changes and P values are indicated (*p < 0.05).

