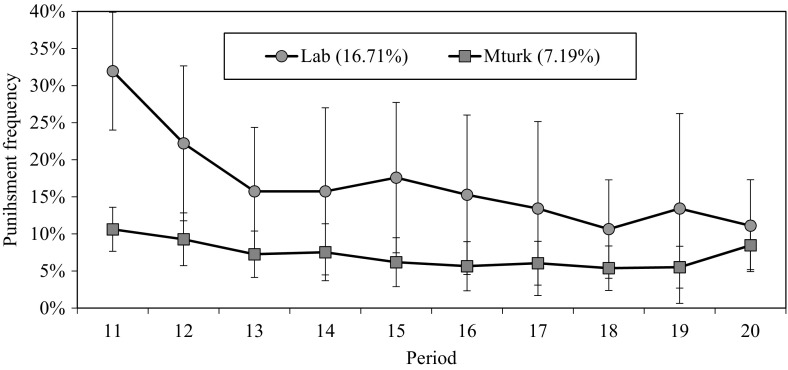
Fig. 3.
Frequencies of punishment over time. Frequencies are calculated by counting instances of assigning non-zero deduction points out of the total number of punishment opportunities per participant, per recipient, per period. Mean punishment frequencies in parenthesis. Error bars indicate 95% confidence intervals clustered on groups

