Figure 3.
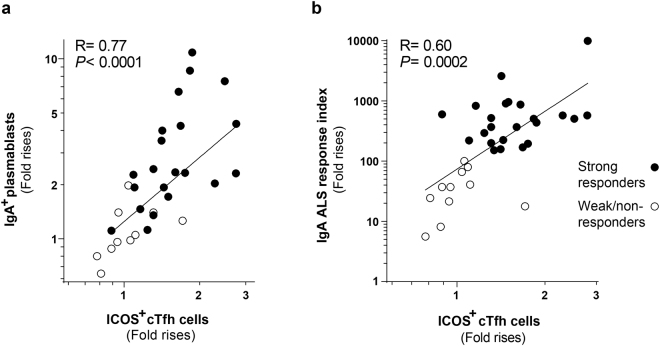
cTfh responses induced by oral ETEC vaccination correlated with blood plasmablast and vaccine specific ALS responses. Correlation between the magnitudes (fold rises) of activated cTfh cell (ICOS+CD4+CXCR5+) and (a) IgA+ plasmablast (IgA+CD27+CD38hiCD19+) responses and (b) the combined response index of vaccine specific IgA ALS responses against the five major vaccine antigens. Each symbol represents one individual; n = 31 in (a) (18 subjects from the primary and 13 from the booster vaccination study) and n = 34 in (b) (20 subjects from the primary and 14 from the booster vaccination study) and data is displayed in a log-log scale plot.

