Figure 1.
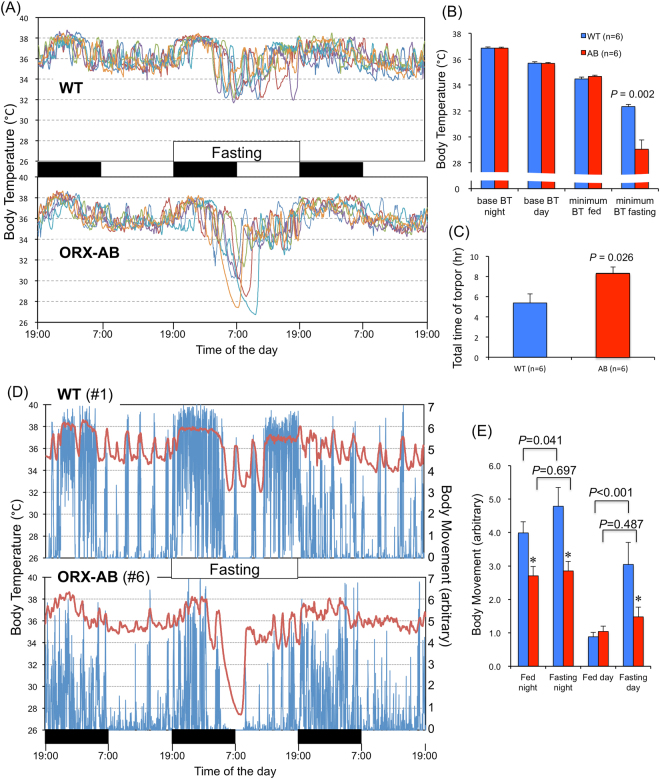
Fasting-induced hypothermia. (A) Individual traces of body temperature for three successive days are presented in different colors for wild-type (WT) mice and orexin neuron-ablated (ORX-AB) mice. Black and white bars in the middle indicate night and day, respectively. Food, but not water, was deprived for 24 hr for the second day. (B) Average body temperature (BT) for the night and day of the 1st day, minimum BT during the 1st day, and minimum BT during the fasting period. (C) Total time spent in hypothermia (torpor). (D) Representative tracings of body temperature (red, left ordinate) and body movement (blue, right ordinate) from a WT and an ORX-AB mouse. (E) Average body movement during the night and day in the 1st fed day and 2nd fasting day. In (B), (C) and (E), data are presented as mean ± SEM of the WT mice (n = 6) and ORX-AB mice (n = 6). P value was calculated using the Mann-Whitney U-test or two-way (genotypes x times) ANOVA with post-hoc Holm-Sidak multiple comparison test.

