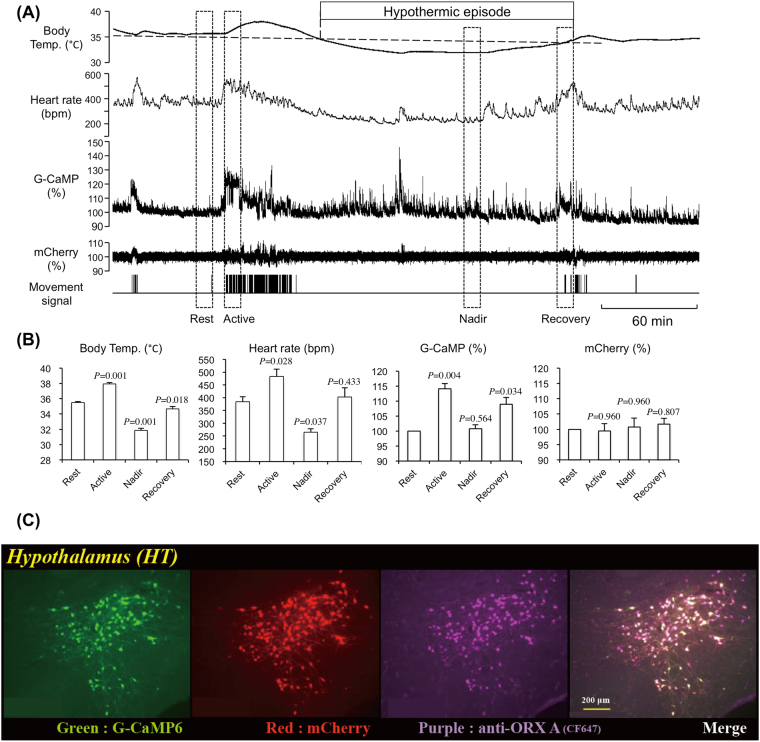
Figure 2.
Activity recording of orexin neurons using fiber photometry during fasting-induced hypothermia. (A) Representative traces of body temperature, heart rate, G-CaMP fluorescence, mCherry fluorescence, and body movement in a mouse expressing G-CaMP and mCherry exclusively in orexin neurons. The first hypothermic episode during the fasting period is shown. (B) Averaged body temperature, heart rate, G-CaMP fluorescence, and mCherry fluorescence during four typical periods indicated by the dashed rectangles (10 min length) shown in A. See text for the definitions of Rest, Active, Nadir, and Recovery. Fluorescence intensity during the rest period was defined as 100%. (C) Histological evidence showing that G-CaMP and mCherry were exclusively expressed in almost all orexin neurons. In (B), data are presented as mean ± SEM of 5 animals. Data were collected only for the 1st hypothermic episode even if the animal experienced multiple hypothermic episodes. P values were calculated using the Holm-Sidak multiple comparison test.

