Figure 6.
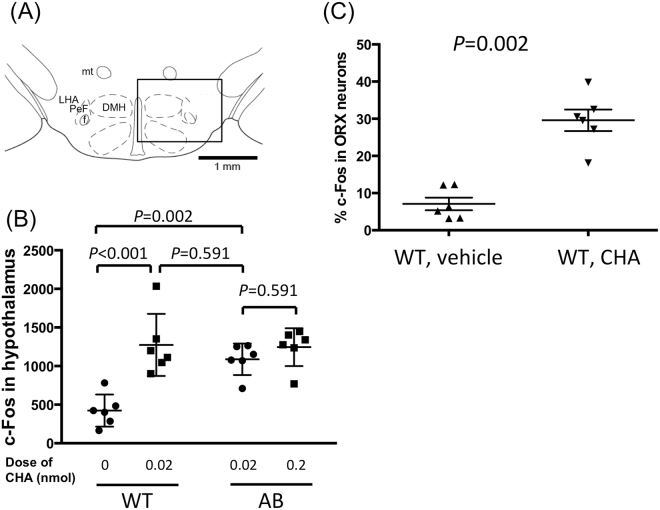
Activation of orexin neurons by CHA. (A) Square field denotes counting area for immunoreactivity. (B) The number of c-Fos positive cells among 4 groups of the mice: WT mice treated with vehicle, WT mice treated with 0.02 nmol of CHA, ORX-AB mice treated with low dose (0.02 nmol) of CHA, and ORX-AB mice treated with high dose (0.2 nmol) of CHA. 2-way ANOVA indicated there was statistical difference between doses (F1,20 = 7.89, p < 0.0108) and between genotypes (F1,20 = 19.86, p = 0.0002). P values were calculated using the Holm-Sidak multiple comparison test. (C) Percentage of the number of double positive cells among orexin immuno-positive cells. P value was calculated using the Mann-Whitney U-test. In (B) and (C), horizontal lines indicate mean and SEM of 6 animals. Keys for the brain structures: DMH, dorsomedial hypothalamus; f, fornix; LHA, lateral hypothalamic area; mt, mammillothalamic tract; PeF, perifornical area.

