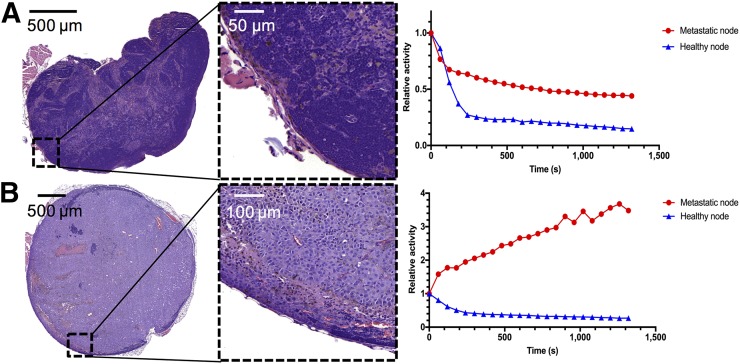
FIGURE 2.
H&E staining and activity curves. (A) Results in mouse bearing only small melanoma cell infiltrates mainly on lymph node border on metastatic side. Activity curves in metastatic compared with healthy node tended to diverge in later scan minutes, showing retention effect in diseased node. (B) Results in mouse with large popliteal lymph node metastasis. Retention effect in diseased node is much higher, and only residual lymphatic tissue is preserved, as shown in H&E staining.

