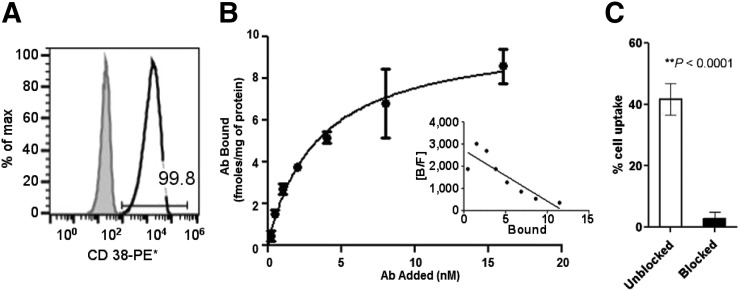
FIGURE 1.
(A) Flow cytometry data validated >99% CD38+ expression as compared with isotype control in human MM1.S myeloma cells. (B) Saturation binding curve for [89Zr]Zr-DFO-daratumumab in MM1.S cells; n = 3. Inset shows Scatchard transformation of saturation binding data. (C) Percentage cell uptake of [89Zr]Zr-DFO-daratumumab in MM1.S cells at 37°C in absence and presence of 100-fold blocking dose of cold daratumumab. PE = phycoerythrin.

