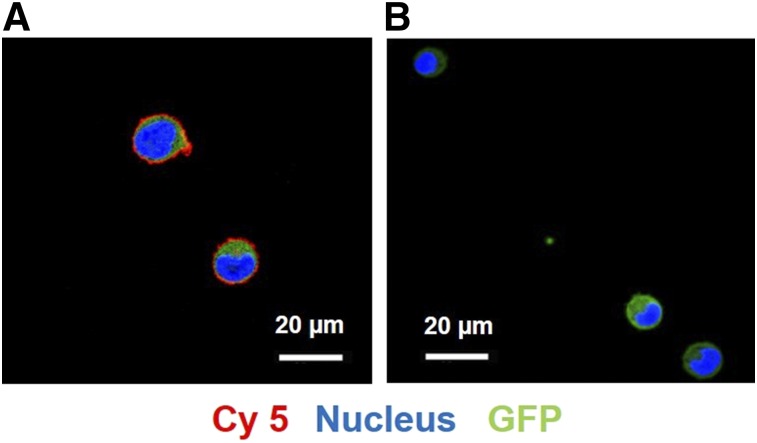
FIGURE 2.
(A) Confocal microscopy images of MM1.S cells treated with daratumumab-Cy5 showed strong cell surface signal (red: Cy5, green: GFP, blue: Hoechst 33342 [nuclear costain]). (B) Cell surface binding is significantly reduced in presence of 100-fold molar excess of unlabeled anti-CD38 antibody as blocking agent. Scale bar represents 20 μm.

