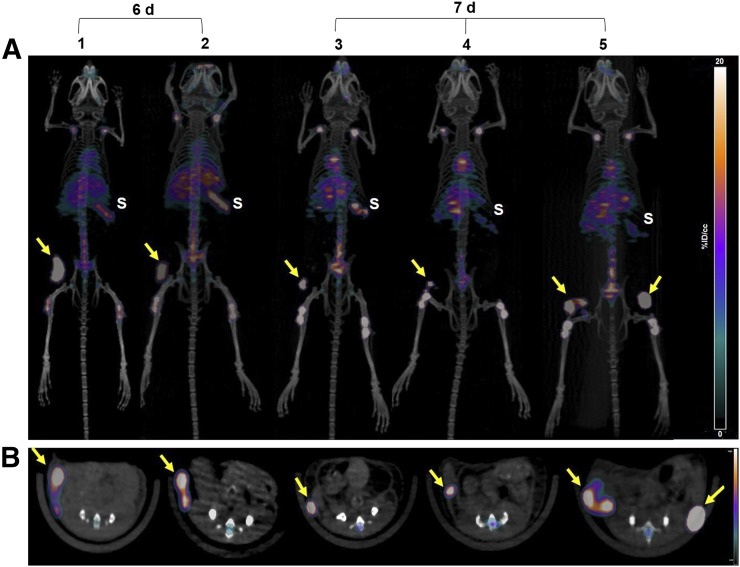
FIGURE 3.
(A) Representative maximum-intensity-projection coronal [89Zr]Zr-DFO-daratumumab PET/CT images in MM1.S subcutaneous tumor–bearing SCID mice at 6 d (n = 2) and 7 d (n = 3) after injection of radiopharmaceutical. (B) Axial planes corresponding to images shown in A. Nonpalpable and palpable tumors with volumes ranging from 8.47 to 128.1 mm3 showed efficient tracer uptake. S = spleen; tumors = yellow arrows.

