FIGURE 5.
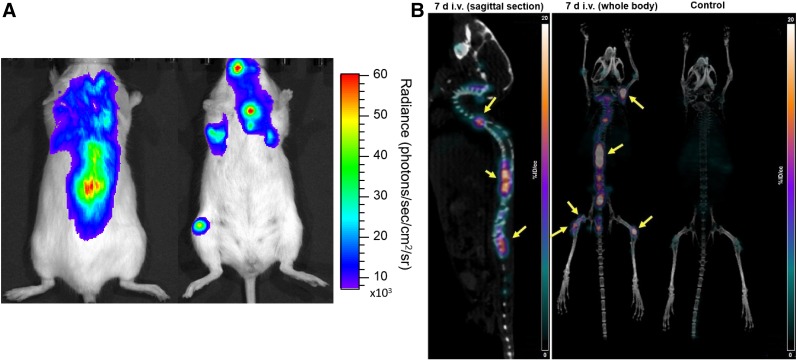
(A) Representative bioluminescence image of mouse in prone and supine positions demonstrating extent of tumor progression in disseminated MM1.S tumor model. (B) [89Zr]Zr-DFO-daratumumab PET/CT image (sagittal and coronal views) of disseminated MM1.S tumor–bearing mouse and nontumor control mouse.

