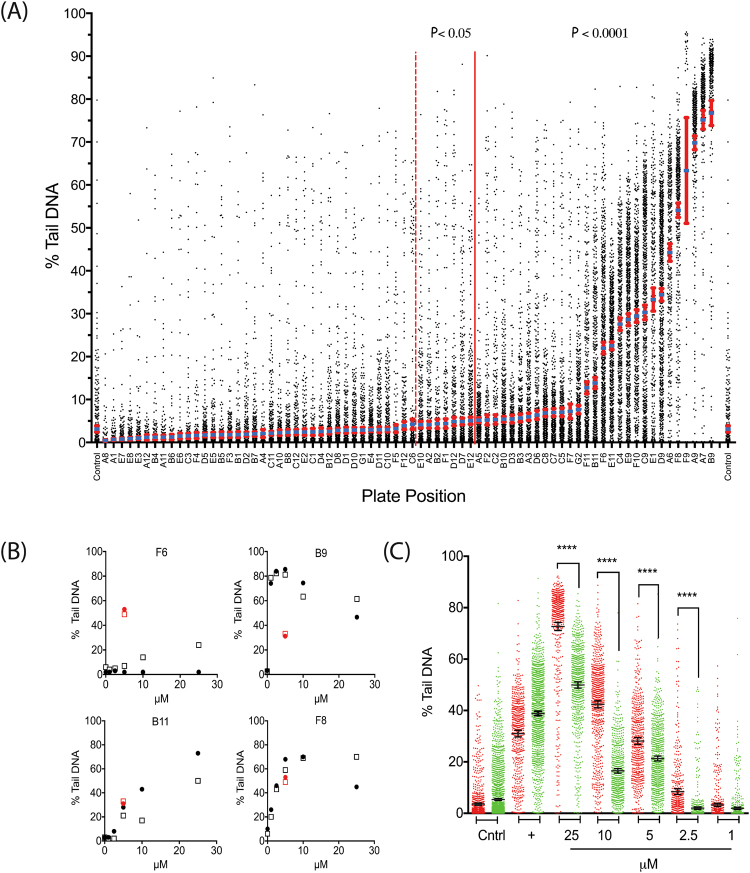
Figure 7.
NTP compound plate screen. (A) Prescreen data from all compounds (A1–G2), showing all points and spread of data. Error bars represent mean +/− 95% CI. Also refer to Tables 1 and 2. Statistical analysis was conducted via a one-sided students t-test. (B) Representative graphs from four compounds. Compound B9 (Thiram) was one of the most genotoxic compounds tested. Cells exposed to compound F8 (another dithiocarbamate compound) also had high levels of DNA damage at low concentrations. Compounds F6 and B11 showed differential response based on p53 status of the cells. Symbols: squares = TK6 and circles = Jurkat (JK). Red symbols are etoposide internal controls for each of the cell lines. (C) Dose-response analysis of compound B11 shows that the JK cells (red) are slightly less sensitive to etoposide (+) control than the TK6 cells (green). Despite this, the JK cells show higher levels of DNA damage than the TK6 cells following treatment with compound B11 (****p < 0.0001). Statistical analysis was conducted via a two-sided Student’s t-test.

