Fig. 2.
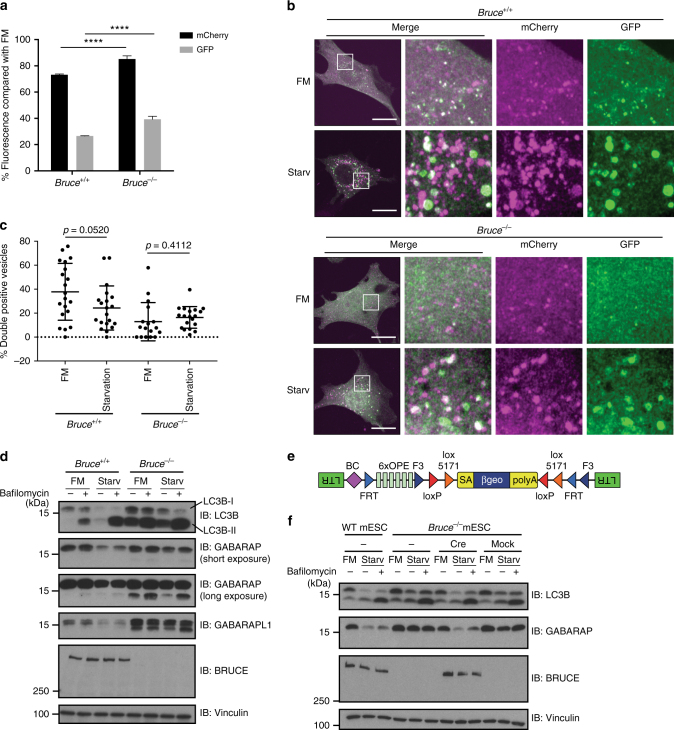
BRUCE is required for starvation-induced degradation of ATG8 family proteins. a Normalized mCherry and GFP signals after starvation compared to basal condition (FM) analyzed by flow cytometry in Bruce+/+ and Bruce−/− MEFs stably expressing mCherry-EGFP-LC3B. Data are presented as mean±SD from three biological replicates (****p < 0.0001). Representative data are shown from four independent experiments. b Confocal microscopy images of Bruce+/+ and Bruce−/− MEFs stably expressing mCherry-EGFP-LC3B in different conditions. FM, fully supplemented medium; Starv, starvation medium for 4 h. Scale bars, 20 µm. c Quantification of mCherry-GFP double positive spots in Bruce+/+ and Bruce−/− MEFs in regular and starvation conditions (as in b). Data are presented as dot plots with mean±SD. n = 20 cells. p-values are indicated and analyzed by t-test. d Protein levels of autophagy markers in Bruce+/+ and Bruce−/− MEFs under basal (FM) and 2 h-starved (Starv) conditions with or without Bafilomycin A1. e A schematic of the inserted gene trap cassette in Bruce−/− haploid mouse embryonic stem cells (mESCs). f Protein levels of autophagy markers in Bruce+/+ and Bruce−/− clone #1 haploid mESCs under basal (FM) and 2 h-starved (Starv) conditions with or without Bafilomycin A1. BRUCE expression was recovered by Cre recombinase in Bruce−/− mESCs and compared with mock infected mESCs

