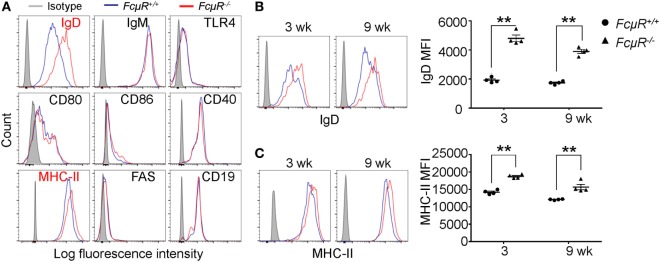
Figure 4.
Elevated IgD and MHC class II expression in FcμR−/− marginal zone B cells (MZB) cells. (A) Expression of IgD, IgM, TLR4, CD80, CD86, CD40, MHC-II, FAS, and CD19 in WT (blue) and FcμR−/− (red) MZB. (B) IgD and (C) MHC-II expression in MZB from 3- and 9-week-old WT and FcμR−/− mice. Left panels, representative FACS profiles; right panels, the results of four WT and FcμR−/− mice. *p < 0.05; **p < 0.01.

